Answered step by step
Verified Expert Solution
Question
1 Approved Answer
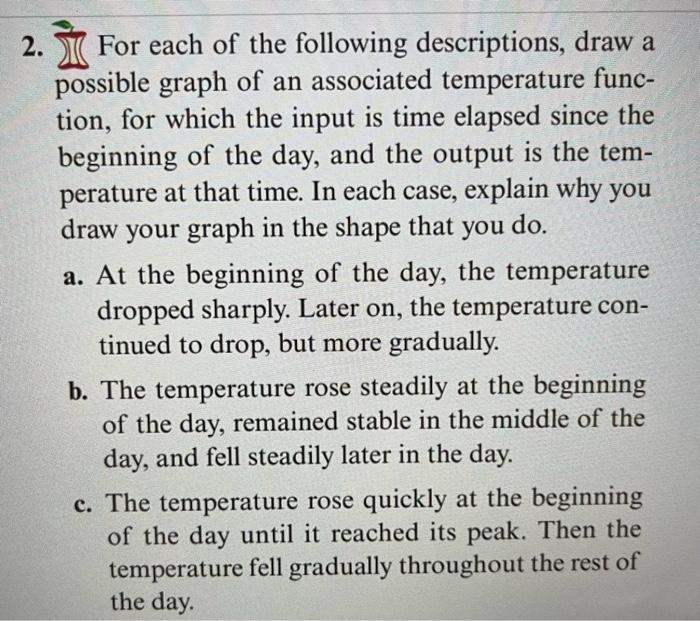
2. For each of the following descriptions, draw a possible graph of an associated temperature func- tion, for which the input is time elapsed

2. For each of the following descriptions, draw a possible graph of an associated temperature func- tion, for which the input is time elapsed since the beginning of the day, and the output is the tem- perature at that time. In each case, explain why you draw your graph in the shape that you do. a. At the beginning of the day, the temperature dropped sharply. Later on, the temperature con- tinued to drop, but more gradually. b. The temperature rose steadily at the beginning of the day, remained stable in the middle of the day, and fell steadily later in the day. c. The temperature rose quickly at the beginning of the day until it reached its peak. Then the temperature fell gradually throughout the rest of the day.
Step by Step Solution
★★★★★
3.30 Rating (156 Votes )
There are 3 Steps involved in it
Step: 1
a For this description the graph would show a steep downward slope at the beginning of the day indicating a sharp drop in temperature As time progress...
Get Instant Access to Expert-Tailored Solutions
See step-by-step solutions with expert insights and AI powered tools for academic success
Step: 2

Step: 3

Ace Your Homework with AI
Get the answers you need in no time with our AI-driven, step-by-step assistance
Get Started


