Answered step by step
Verified Expert Solution
Question
1 Approved Answer
2. Four different designs for a digital computer circuit are being studied in order to compare the amount of noise present. The following data have
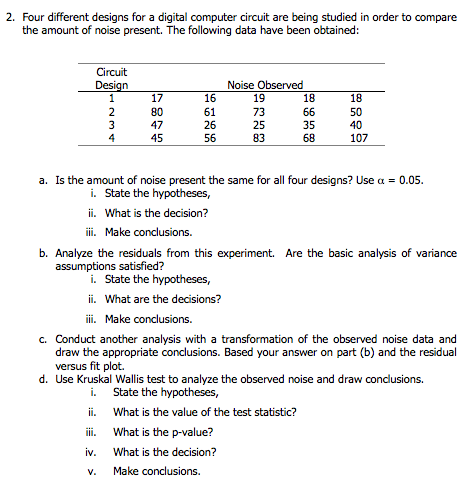
2. Four different designs for a digital computer circuit are being studied in order to compare the amount of noise present. The following data have been obtained Circuit Noise Observed 16 61 26 56 19 73 25 17 18 18 50 40 107 47 45 35 68 a. Is the amount of noise present the same for all four designs? Use -0.05 i. State the hypotheses, ii. What is the decision? iii. Make conclusions. b. Analyze the residuals from this experiment. Are the basic analysis of variance assumptions satisfied? i. ii. iii. State the hypotheses, What are the decisions? Make conclusions. c. Conduct another analysis with a transformation of the observed noise data and draw the appropriate conclusions. Based your answer on part (b) and the residual versus fit plot. d. Use Kruskal Wallis test to analyze the observed noise and draw conclusions. i. State the hypotheses, ii. What is the value of the test statistic? ii What is the p-value? iv. What is the decision? v. Make conclusions. 2. Four different designs for a digital computer circuit are being studied in order to compare the amount of noise present. The following data have been obtained Circuit Noise Observed 16 61 26 56 19 73 25 17 18 18 50 40 107 47 45 35 68 a. Is the amount of noise present the same for all four designs? Use -0.05 i. State the hypotheses, ii. What is the decision? iii. Make conclusions. b. Analyze the residuals from this experiment. Are the basic analysis of variance assumptions satisfied? i. ii. iii. State the hypotheses, What are the decisions? Make conclusions. c. Conduct another analysis with a transformation of the observed noise data and draw the appropriate conclusions. Based your answer on part (b) and the residual versus fit plot. d. Use Kruskal Wallis test to analyze the observed noise and draw conclusions. i. State the hypotheses, ii. What is the value of the test statistic? ii What is the p-value? iv. What is the decision? v. Make conclusions
Step by Step Solution
There are 3 Steps involved in it
Step: 1
Get Instant Access to Expert-Tailored Solutions
See step-by-step solutions with expert insights and AI powered tools for academic success
Step: 2
Step: 3
Ace Your Homework with AI
Get the answers you need in no time with our AI-driven, step-by-step assistance
Get Started