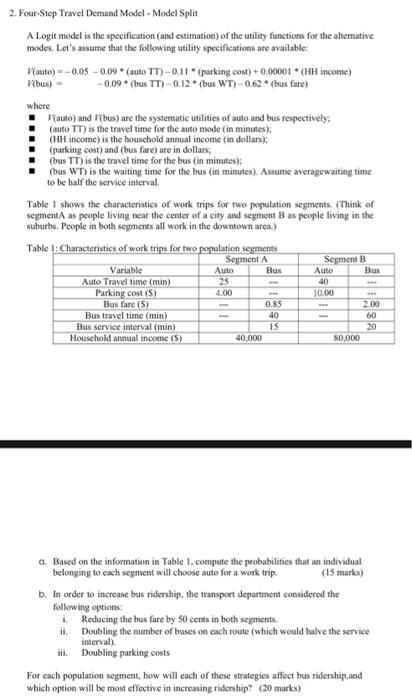
2. Four-Step Travel Demand Model - Model Split A Logit model is the specification (and estimation) of the utility functions for the alterative modes. Let's assume that the following utility specifications are available: auto) -0.05 -0.09 * (auto TT) -0.11.(parking cost) + 0.00001 (HH income) bus) - -0,09 bus TT)-0.12. (bus WT)-0.62 (bus fare) where auto) and bus) are the systematic utilities of auto and bus respectively, (auto TT) is the travel time for the auto mode (in minutes) (HH income) is the household annual income (in dollars); (parking cost) and (bus fare) are in dollars, (bus TT) is the travel time for the bus (in minutes): (bus WT) is the waiting time for the bus (in minutes). Assume averagewaiting time to be half the service interval. Table 1 shows the characteristics of work trips for two population segments. (Think of segmentA as people living near the center of a city and segment B as people living in the suburbs. People in both segments all work in the downtown arca.) Table 1: Characteristics of work trips for two population segments Seyment A Segment B Variable Auto Auto Bus Auto Travel time (min) Parking cost (S) Bus faire (S) Bus travel time (min) Bus service interval (min) 15 Household annual income (5) Bus 25 4.00 0.85 40 40 10.00 2.00 60 20 80,000 40,000 a. Based on the information in Table 1. compute the probabilities that an individual belonging to each seyment will choose auto for a work trip (15 marks) b. In order to increase bus ridership, the transport department considered the following options i Reducing the bus fure by 50 cents in both segments. i Doubling the number of buses on cach route (which would have the service interval). Doubling parking costs For each population segment, how will each of these strategies affect bus ridership and which option will be most effective in increasing ridership? (20 marks) 2. Four-Step Travel Demand Model - Model Split A Logit model is the specification (and estimation) of the utility functions for the alterative modes. Let's assume that the following utility specifications are available: auto) -0.05 -0.09 * (auto TT) -0.11.(parking cost) + 0.00001 (HH income) bus) - -0,09 bus TT)-0.12. (bus WT)-0.62 (bus fare) where auto) and bus) are the systematic utilities of auto and bus respectively, (auto TT) is the travel time for the auto mode (in minutes) (HH income) is the household annual income (in dollars); (parking cost) and (bus fare) are in dollars, (bus TT) is the travel time for the bus (in minutes): (bus WT) is the waiting time for the bus (in minutes). Assume averagewaiting time to be half the service interval. Table 1 shows the characteristics of work trips for two population segments. (Think of segmentA as people living near the center of a city and segment B as people living in the suburbs. People in both segments all work in the downtown arca.) Table 1: Characteristics of work trips for two population segments Seyment A Segment B Variable Auto Auto Bus Auto Travel time (min) Parking cost (S) Bus faire (S) Bus travel time (min) Bus service interval (min) 15 Household annual income (5) Bus 25 4.00 0.85 40 40 10.00 2.00 60 20 80,000 40,000 a. Based on the information in Table 1. compute the probabilities that an individual belonging to each seyment will choose auto for a work trip (15 marks) b. In order to increase bus ridership, the transport department considered the following options i Reducing the bus fure by 50 cents in both segments. i Doubling the number of buses on cach route (which would have the service interval). Doubling parking costs For each population segment, how will each of these strategies affect bus ridership and which option will be most effective in increasing ridership? (20 marks)


