

Answered step by step
Verified Expert Solution
Question
1 Approved Answer
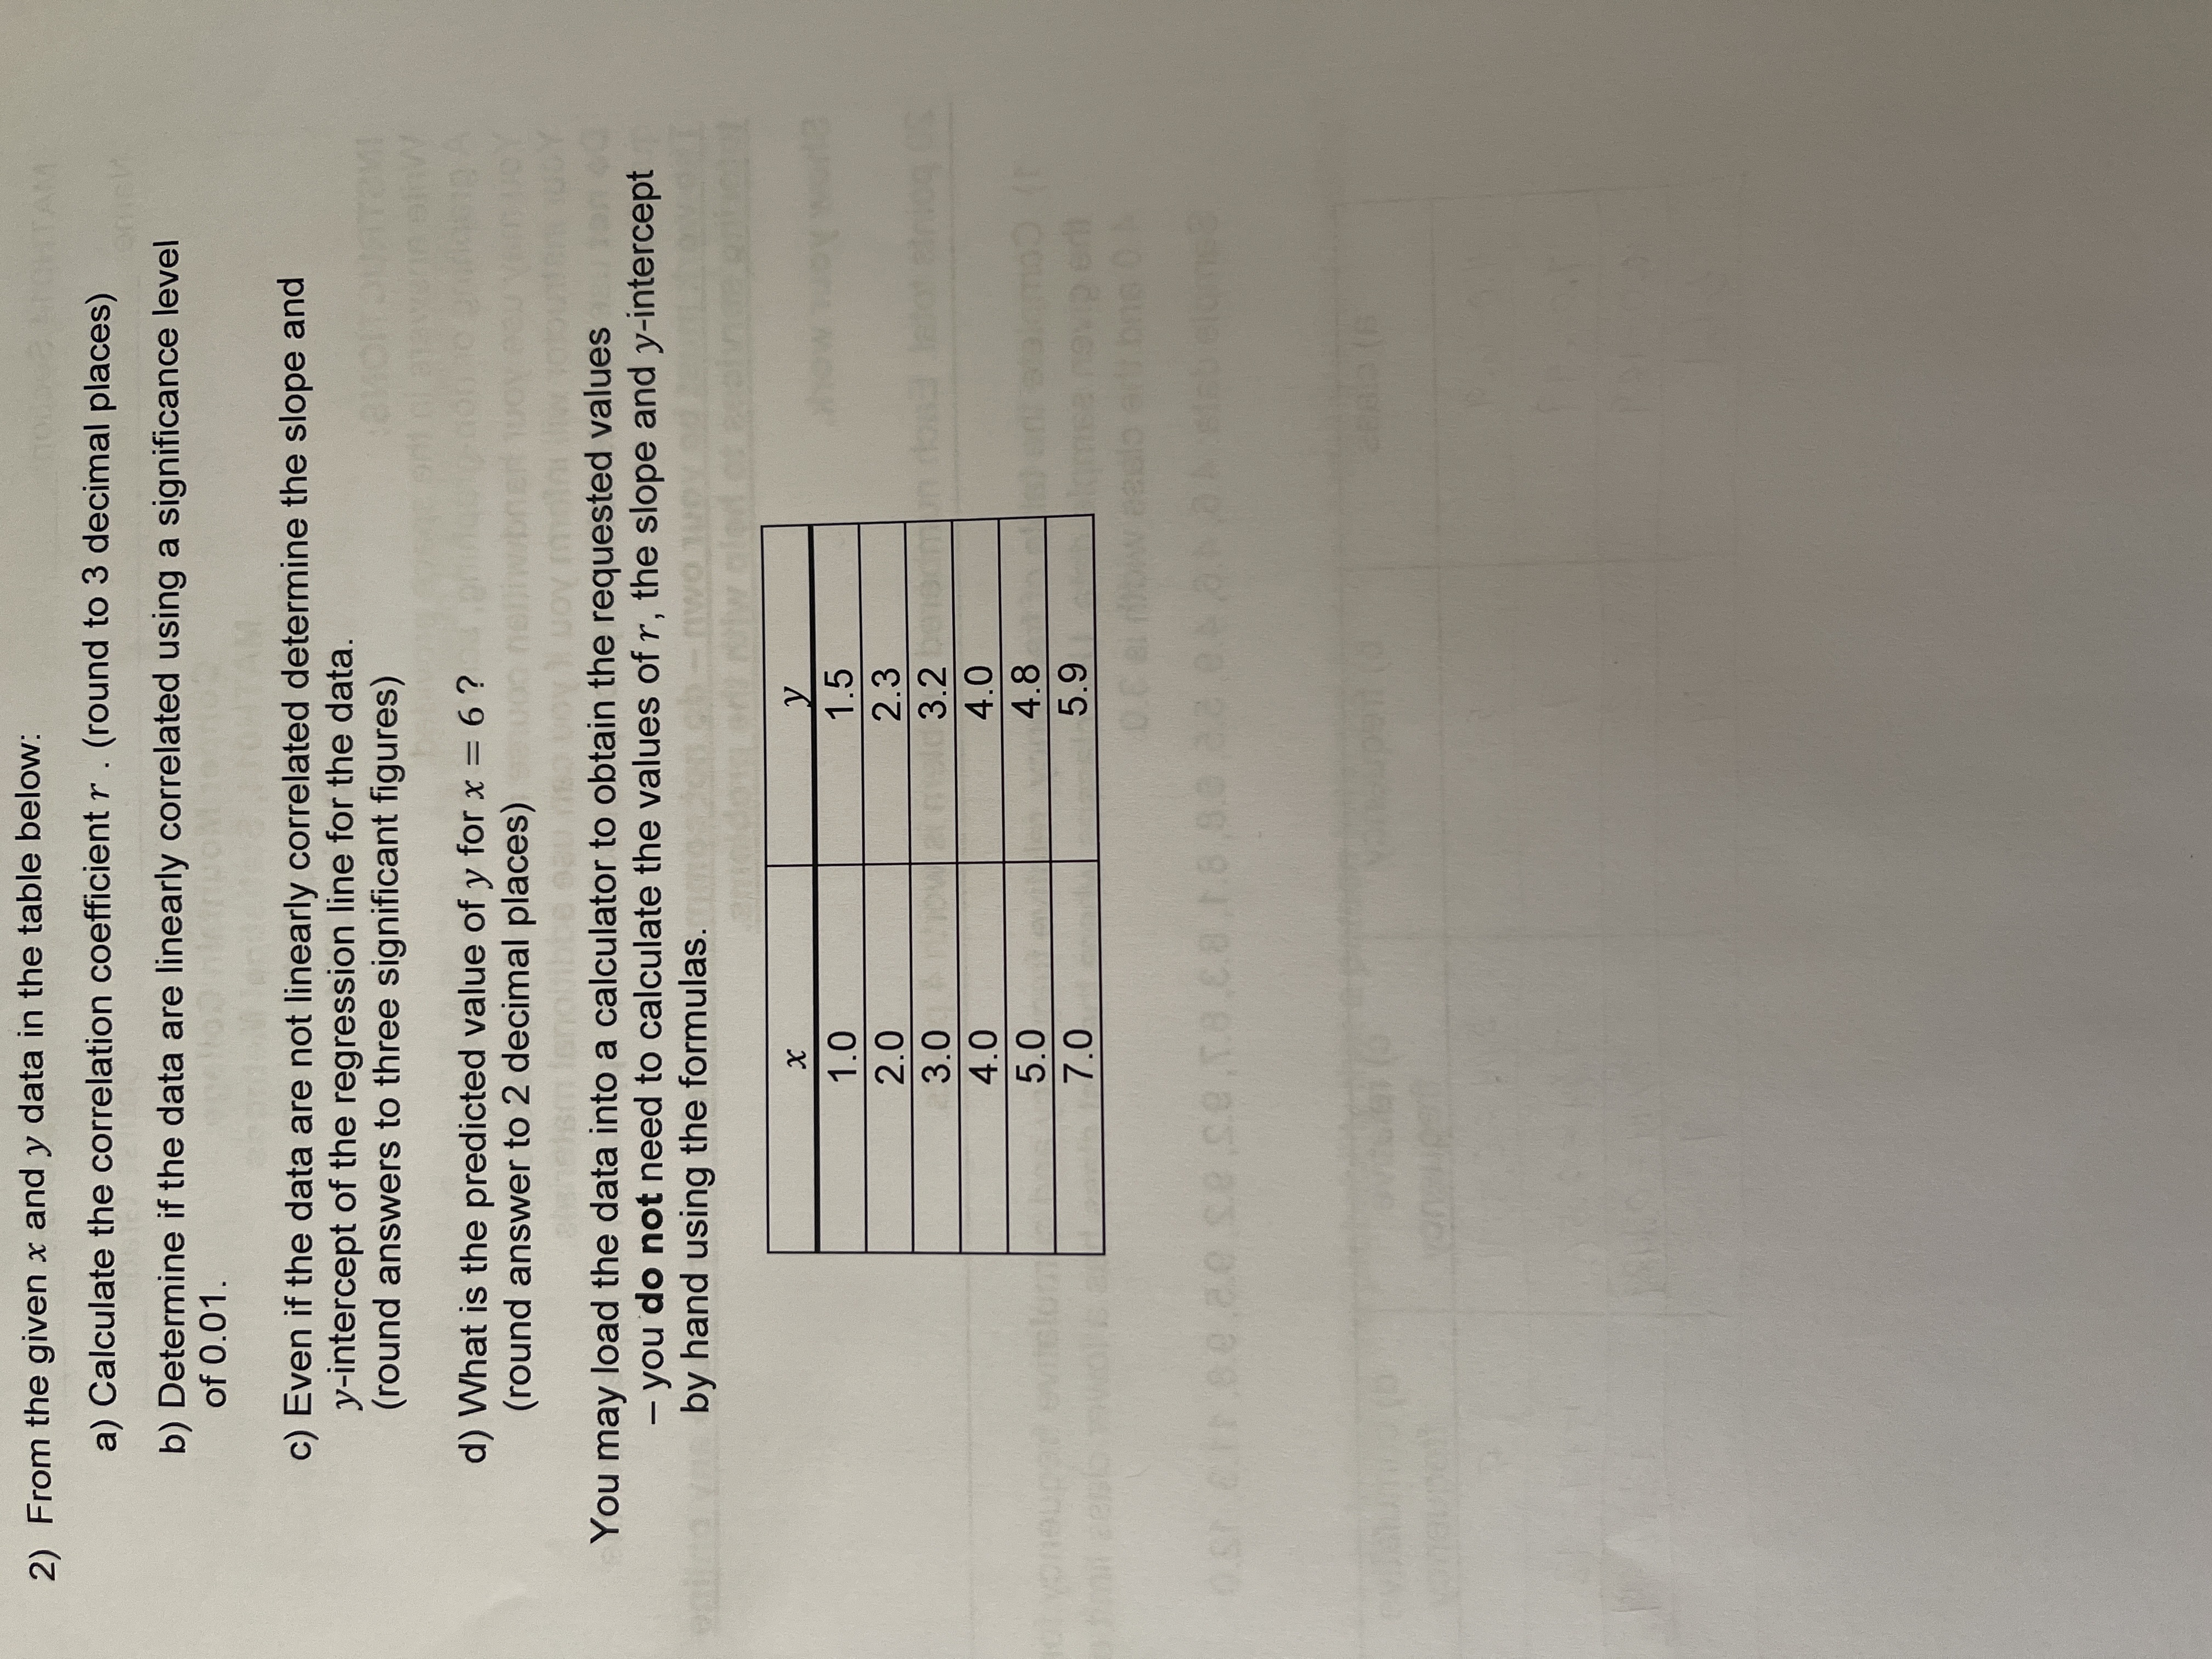
2) From the given x and y data in the table below: a) Calculate the correlation coefficient r . (round to 3 decimal places) b)
Step by Step Solution
There are 3 Steps involved in it
Step: 1

Get Instant Access to Expert-Tailored Solutions
See step-by-step solutions with expert insights and AI powered tools for academic success
Step: 2

Step: 3
Ace Your Homework with AI
Get the answers you need in no time with our AI-driven, step-by-step assistance
Get Started
Algebra And Trigonometry Enhanced With Graphing Utilities (Subscription)
Authors: Michael, Michael Sullivan III, Michael III Sullivan, Michael Sullivan 111, III Sullivan
6th Edition