

Answered step by step
Verified Expert Solution
Question
1 Approved Answer
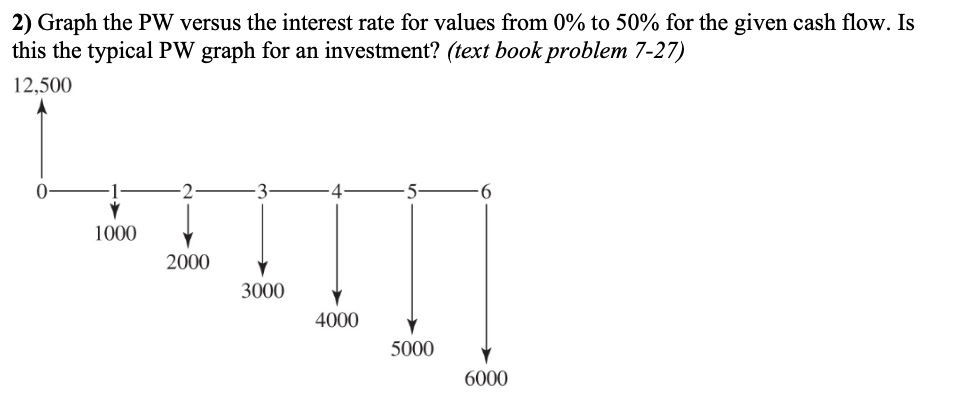
2) Graph the PW versus the interest rate for values from 0% to 50% for the given cash flow. Is this the typical PW graph
Step by Step Solution
There are 3 Steps involved in it
Step: 1

Get Instant Access to Expert-Tailored Solutions
See step-by-step solutions with expert insights and AI powered tools for academic success
Step: 2

Step: 3
Ace Your Homework with AI
Get the answers you need in no time with our AI-driven, step-by-step assistance
Get Started
Venture Capital Islamic Finance And SMEs Valuation Structuring And Monitoring Practices In India
Authors: M. Durrani, G. Boocock
1st Edition
1403936382,0230626254