Answered step by step
Verified Expert Solution
Question
1 Approved Answer
Choose 2 of the following questions to answer. Build at least one ggplot to answer each question (you can also do other calculations in

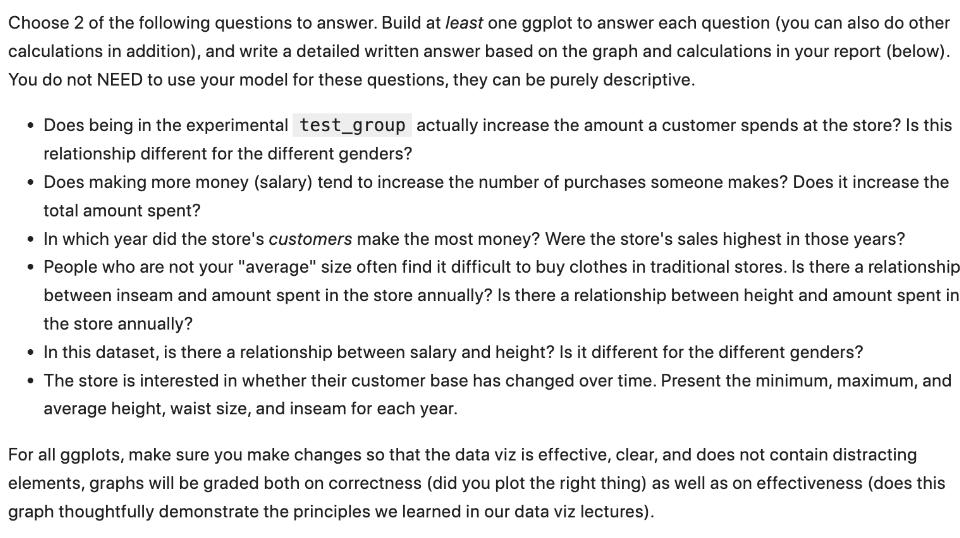
Choose 2 of the following questions to answer. Build at least one ggplot to answer each question (you can also do other calculations in addition), and write a detailed written answer based on the graph and calculations in your report (below). You do not NEED to use your model for these questions, they can be purely descriptive. Does being in the experimental test_group actually increase the amount a customer spends at the store? Is this relationship different for the different genders? Does making more money (salary) tend to increase the number of purchases someone makes? Does it increase the total amount spent? In which year did the store's customers make the most money? Were the store's sales highest in those years? People who are not your "average" size often find it difficult to buy clothes in traditional stores. Is there a relationship between inseam and amount spent in the store annually? Is there a relationship between height and amount spent in the store annually? In this dataset, is there a relationship between salary and height? Is it different for the different genders? The store is interested in whether their customer base has changed over time. Present the minimum, maximum, and average height, waist size, and inseam for each year. For all ggplots, make sure you make changes so that the data viz is effective, clear, and does not contain distracting elements, graphs will be graded both on correctness (did you plot the right thing) as well as on effectiveness (does this graph thoughtfully demonstrate the principles we learned in our data viz lectures).
Step by Step Solution
There are 3 Steps involved in it
Step: 1
ggplotstoredata aesx testgroup y amountspent color gender geomboxplot labstitle Amount spent by test ...
Get Instant Access to Expert-Tailored Solutions
See step-by-step solutions with expert insights and AI powered tools for academic success
Step: 2

Step: 3

Ace Your Homework with AI
Get the answers you need in no time with our AI-driven, step-by-step assistance
Get Started


