Answered step by step
Verified Expert Solution
Link Copied!

Question

1 Approved Answer

2. Here you need to show your familiarity with the exponential smoothing forecast calculations, and the calculation of MAE. The first four data points were

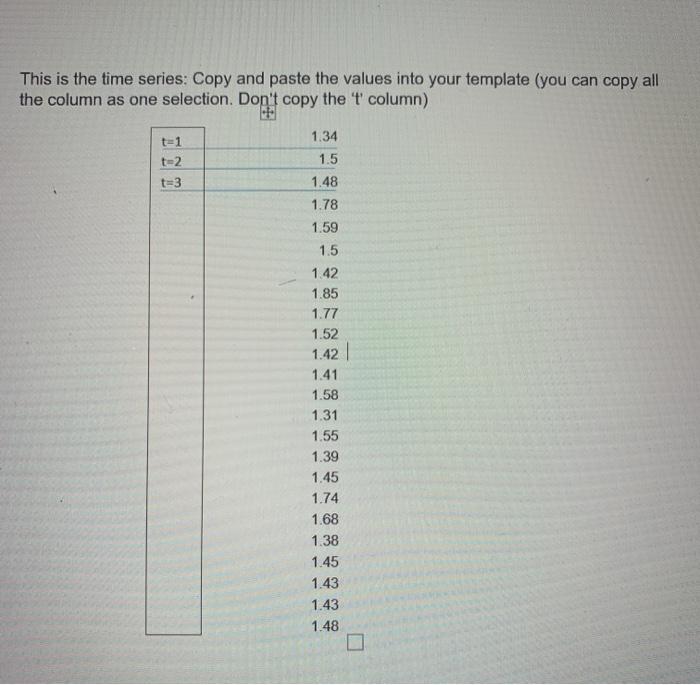
2. Here you need to show your familiarity with the exponential smoothing forecast calculations, and the calculation of MAE. The first four data points were separated from the rest of the time series. Pretend this is now the only sample you have available (Y1 = 1.34, Y2 = 1.5, Y3 = 1.48, Y4 = 1.78).

(i) Show process of calculating F3+1, F4+1, and F4+3 for the reduced time series of Y1, Y2, Y3, and Y4, using the Expon. Smooth. with alpha = 0.6

(ii) Show how you would calculate MAE for the reduced sample shown above when using the 3-period moving average forecasts you calculated in part (i).

t=1

t=2

t=3

1.34

1.5

1.48

1.78

1.59

1.5

1.42

1.85

1.77

1.52

1.42

1.41

1.58

1.31

1.55

1.39

1.45

1.74

1.68

1.38

1.45

1.43

1.43

1.48

image text in transcribed
2. Here you need to show your familiarity with the exponential smoothing forecast calculations, and the calculation of MAE. The first four data points were separated from the rest of the time series. Pretend this is now the only sample you have available (Y1 = 1.34, Y2 = 1.5, Y3 = 1.48, Y4 = 1.78). (i) Show process of calculating F3+1, F4+1, and F4+3 for the reduced time series of Y1, Y2, Y3, and Y4, using the Expen. Smooth. with alpha = 0.6 (ii) Show how you would calculate MAE for the reduced sample shown above when using the 3-period moving average forecasts you calculated in part (1) This is the time series: Copy and paste the values into your template (you can copy all the column as one selection. Don't copy the 't' column) t-2 t=3 1.34 1.5 1.48 1.78 1.59 1.5 1.42 1.85 1.77 1.52 1.42 1.41 1.58 1.31 1.55 1.39 1.45 1.74 1.68 1.38 1.45 1.43 1.43 1.48 2. Here you need to show your familiarity with the exponential smoothing forecast calculations, and the calculation of MAE. The first four data points were separated from the rest of the time series. Pretend this is now the only sample you have available (Y1 = 1.34, Y2 = 1.5, Y3 = 1.48, Y4 = 1.78). (i) Show process of calculating F3+1, F4+1, and F4+3 for the reduced time series of Y1, Y2, Y3, and Y4, using the Expen. Smooth. with alpha = 0.6 (ii) Show how you would calculate MAE for the reduced sample shown above when using the 3-period moving average forecasts you calculated in part (1) This is the time series: Copy and paste the values into your template (you can copy all the column as one selection. Don't copy the 't' column) t-2 t=3 1.34 1.5 1.48 1.78 1.59 1.5 1.42 1.85 1.77 1.52 1.42 1.41 1.58 1.31 1.55 1.39 1.45 1.74 1.68 1.38 1.45 1.43 1.43 1.48
Step by Step Solution

There are 3 Steps involved in it

Step: 1

blur-text-image

Get Instant Access to Expert-Tailored Solutions

See step-by-step solutions with expert insights and AI powered tools for academic success

Step: 2

blur-text-image

Step: 3

blur-text-image

Ace Your Homework with AI

Get the answers you need in no time with our AI-driven, step-by-step assistance

Get Started

Students also viewed these Finance questions

Question

What sector and functional experience are we looking for?

Answered: 1 week ago

Question

How does version history act as a control for data files?

Answered: 1 week ago

Question

How many attributes/fields are available in the dataset?

Answered: 1 week ago

Question

Where are most of these attributes located?

Answered: 1 week ago