

Answered step by step
Verified Expert Solution
Question
1 Approved Answer
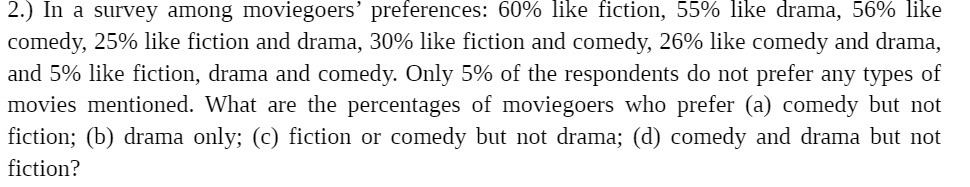
2.) In a survey among moviegoers' preferences: 60% like fiction, 55% like drama, 56% like comedy, 25% like fiction and drama, 30% like fiction and
Step by Step Solution
There are 3 Steps involved in it
Step: 1

Get Instant Access to Expert-Tailored Solutions
See step-by-step solutions with expert insights and AI powered tools for academic success
Step: 2

Step: 3
Ace Your Homework with AI
Get the answers you need in no time with our AI-driven, step-by-step assistance
Get Started
Shape Optimization And Optimal Design
Authors: John Cagnol
1st Edition
0824705564, 978-0824705565