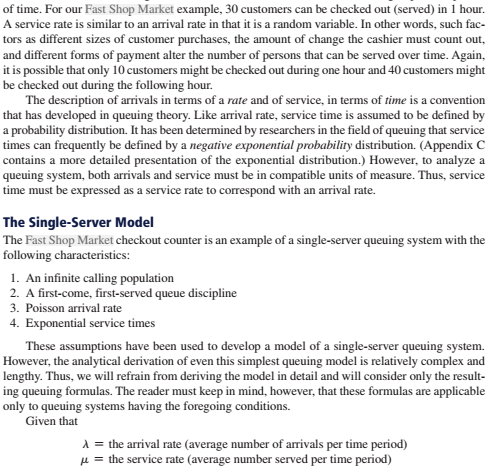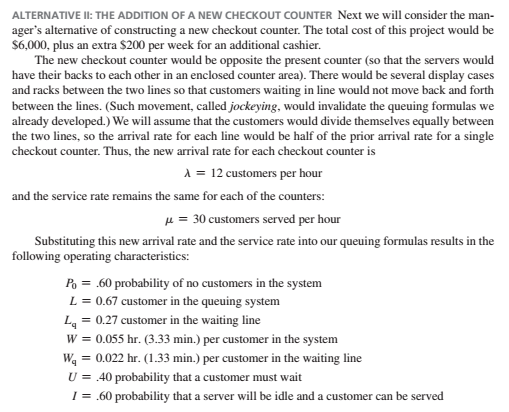


2. In the Fast Shop Market example in this chapter, Alternative II was to add a new checkout counter at the market. This alternative was analyzed using the single-server model. Why was the multiple- server model not used? of time. For our Fast Shop Market example, 30 customers can be checked out (served) in 1 hour. A service rate is similar to an arrival rate in that it is a random variable. In other words, such fac- tors as different sizes of customer purchases, the amount of change the cashier must count out, and different forms of payment alter the number of persons that can be served over time. Again, it is possible that only 10 customers might be checked out during one hour and 40 customers might be checked out during the following hour. The description of arrivals in terms of a rate and of service, in terms of time is a convention that has developed in queuing theory. Like arrival rate, service time is assumed to be defined by a probability distribution. It has been determined by researchers in the field of queuing that service times can frequently be defined by a negative exponential probability distribution. (Appendix C contains a more detailed presentation of the exponential distribution. However, to analyze a queuing system, both arrivals and service must be in compatible units of measure. Thus, service time must be expressed as a service rate to correspond with an arrival rate. The Single-Server Model The Fast Shop Market checkout counter is an example of a single-server queuing system with the following characteristics: 1. An infinite calling population 2. A first-come, first-served queue discipline 3. Poisson arrival rate 4. Exponential service times These assumptions have been used to develop a model of a single-server queuing system. However, the analytical derivation of even this simplest queuing model is relatively complex and lengthy. Thus, we will refrain from deriving the model in detail and will consider only the result- ing queuing formulas. The reader must keep in mind, however, that these formulas are applicable only to queuing systems having the foregoing conditions. Given that 1 = the arrival rate (average number of arrivals per time period) u = the service rate (average number served per time period) ALTERNATIVE II: THE ADDITION OF A NEW CHECKOUT COUNTER Next we will consider the man- ager's alternative of constructing a new checkout counter. The total cost of this project would be $6,000, plus an extra $200 per week for an additional cashier. The new checkout counter would be opposite the present counter (so that the servers would have their backs to each other in an enclosed counter area). There would be several display cases and racks between the two lines so that customers waiting in line would not move back and forth between the lines. (Such movement, called jockeying, would invalidate the queuing formulas we already developed.) We will assume that the customers would divide themselves equally between the two lines, so the arrival rate for each line would be half of the prior arrival rate for a single checkout counter. Thus, the new arrival rate for each checkout counter is 1 = 12 customers per hour and the service rate remains the same for each of the counters: u = 30 customers served per hour Substituting this new arrival rate and the service rate into our queuing formulas results in the following operating characteristics: Po = .60 probability of no customers in the system L = 0.67 customer in the queuing system L = 0.27 customer in the waiting line W = 0.055 hr. (3.33 min.) per customer in the system W, = 0.022 hr. (1.33 min.) per customer in the waiting line U = 40 probability that a customer must wait I = .60 probability that a server will be idle and a customer can be served 2. In the Fast Shop Market example in this chapter, Alternative II was to add a new checkout counter at the market. This alternative was analyzed using the single-server model. Why was the multiple- server model not used? of time. For our Fast Shop Market example, 30 customers can be checked out (served) in 1 hour. A service rate is similar to an arrival rate in that it is a random variable. In other words, such fac- tors as different sizes of customer purchases, the amount of change the cashier must count out, and different forms of payment alter the number of persons that can be served over time. Again, it is possible that only 10 customers might be checked out during one hour and 40 customers might be checked out during the following hour. The description of arrivals in terms of a rate and of service, in terms of time is a convention that has developed in queuing theory. Like arrival rate, service time is assumed to be defined by a probability distribution. It has been determined by researchers in the field of queuing that service times can frequently be defined by a negative exponential probability distribution. (Appendix C contains a more detailed presentation of the exponential distribution. However, to analyze a queuing system, both arrivals and service must be in compatible units of measure. Thus, service time must be expressed as a service rate to correspond with an arrival rate. The Single-Server Model The Fast Shop Market checkout counter is an example of a single-server queuing system with the following characteristics: 1. An infinite calling population 2. A first-come, first-served queue discipline 3. Poisson arrival rate 4. Exponential service times These assumptions have been used to develop a model of a single-server queuing system. However, the analytical derivation of even this simplest queuing model is relatively complex and lengthy. Thus, we will refrain from deriving the model in detail and will consider only the result- ing queuing formulas. The reader must keep in mind, however, that these formulas are applicable only to queuing systems having the foregoing conditions. Given that 1 = the arrival rate (average number of arrivals per time period) u = the service rate (average number served per time period) ALTERNATIVE II: THE ADDITION OF A NEW CHECKOUT COUNTER Next we will consider the man- ager's alternative of constructing a new checkout counter. The total cost of this project would be $6,000, plus an extra $200 per week for an additional cashier. The new checkout counter would be opposite the present counter (so that the servers would have their backs to each other in an enclosed counter area). There would be several display cases and racks between the two lines so that customers waiting in line would not move back and forth between the lines. (Such movement, called jockeying, would invalidate the queuing formulas we already developed.) We will assume that the customers would divide themselves equally between the two lines, so the arrival rate for each line would be half of the prior arrival rate for a single checkout counter. Thus, the new arrival rate for each checkout counter is 1 = 12 customers per hour and the service rate remains the same for each of the counters: u = 30 customers served per hour Substituting this new arrival rate and the service rate into our queuing formulas results in the following operating characteristics: Po = .60 probability of no customers in the system L = 0.67 customer in the queuing system L = 0.27 customer in the waiting line W = 0.055 hr. (3.33 min.) per customer in the system W, = 0.022 hr. (1.33 min.) per customer in the waiting line U = 40 probability that a customer must wait I = .60 probability that a server will be idle and a customer can be served


