Answered step by step
Verified Expert Solution
Link Copied!

Question

1 Approved Answer

2. In the table below, a survey of 200 individuals were classified according to their Age and whom they voted for in a recent election
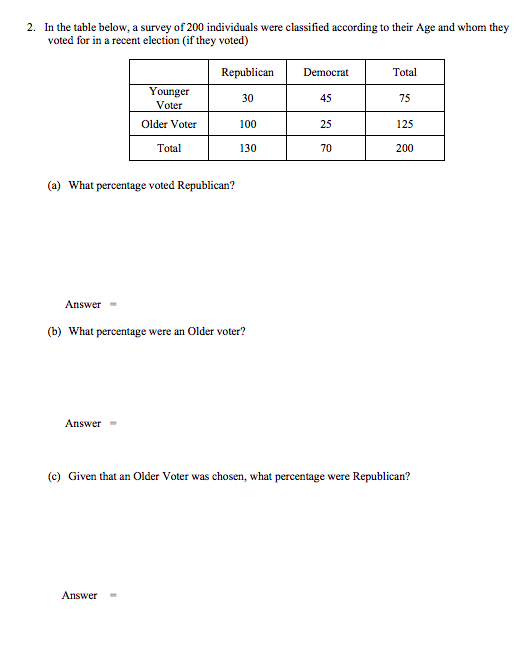
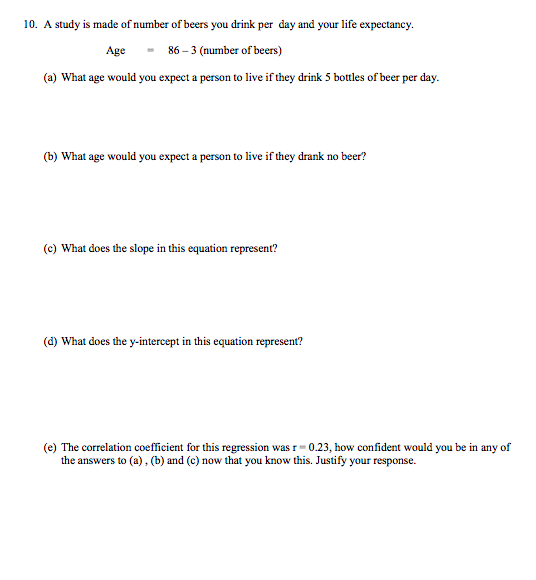
image text in transcribedimage text in transcribed
2. In the table below, a survey of 200 individuals were classified according to their Age and whom they voted for in a recent election (if they voted) Republican Democrat Total Younger Voter 30 45 75 Older Voter 100 25 125 Total 130 70 200 (a) What percentage voted Republican? Answer (b) What percentage were an Older voter? Answer (c) Given that an Older Voter was chosen, what percentage were Republican? Answer10. A study is made of number of beers you drink per day and your life expectancy. Age - 86 -3 (number of beers) (a) What age would you expect a person to live if they drink 5 bottles of beer per day. (b) What age would you expect a person to live if they drank no beer? (c) What does the slope in this equation represent? (d) What does the y-intercept in this equation represent? (e) The correlation coefficient for this regression was r = 0.23, how confident would you be in any of the answers to (a) , (b) and (c) now that you know this. Justify your response

Step by Step Solution

There are 3 Steps involved in it

Step: 1

blur-text-image

Get Instant Access to Expert-Tailored Solutions

See step-by-step solutions with expert insights and AI powered tools for academic success

Step: 2

blur-text-image_2

Step: 3

blur-text-image_3

Ace Your Homework with AI

Get the answers you need in no time with our AI-driven, step-by-step assistance

Get Started

Recommended Textbook for

Probability and Random Processes With Applications to Signal Processing and Communications

Authors: Scott Miller, Donald Childers

2nd edition

123869811, 978-0121726515, 121726517, 978-0130200716, 978-0123869814

More Books

Students also viewed these Mathematics questions