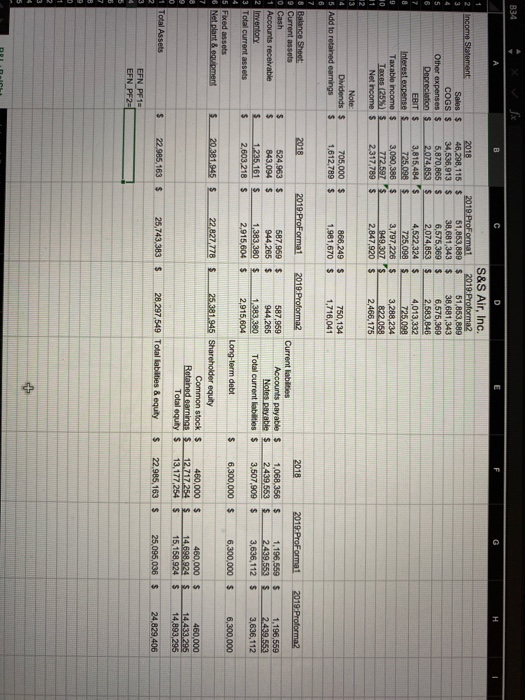
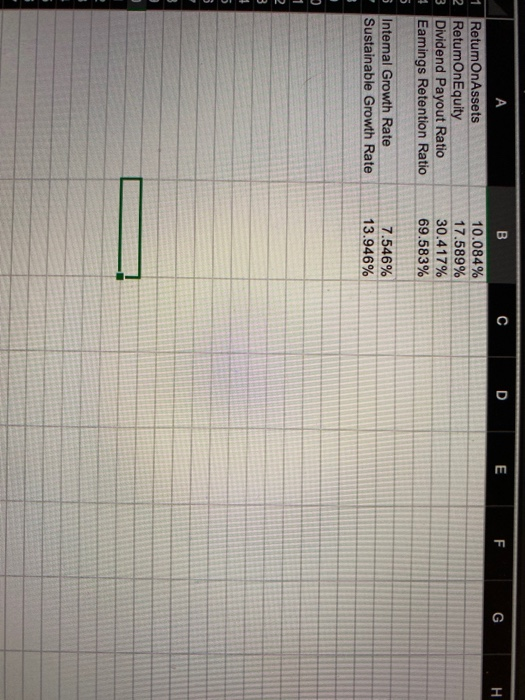
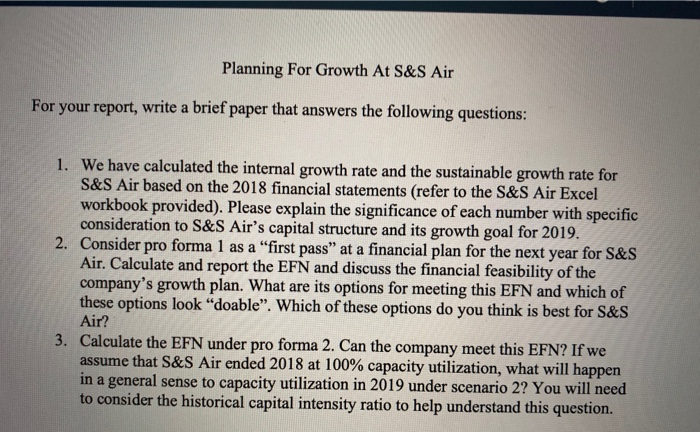
2 Income Statement Sales $ COGS $ Other expenses Depreciation S EBIT $ Interest expense Taxable income $ Taxos 25 Net Income $ S&S Air, Inc. 2019 ProForma1 2019.Proforma2 46,238,115 $ 51,853,889 $ 51,853,889 34,536,913 $ 38,681,343 $ 38,681,343 5,870,865 $ 6,575,369 $ 6,575,369 2.074.853 $ 2,074,853 $ 2.583.846 3,815,484 $ 4,522,324 $ 4,013,332 725.098 $ 725,09 725.099 3,090,386 $ 3,797,226 $ 3,288,234 72592S 822.058 2,317,789 $ 2.847,920 $ 2,466,175 Note: Dividends $ 5 Add to retained earnings 705,000 $ 1,612,789 $ 868,249 1,981,670 $ $ 750,134 1,716,041 2018 2019:Proforma2 8 Balance Sheet 9 Current assets O Cash Accounts receivable Inventory Total current assets 2019. ProFormat $ 1,196,569 2439.553 $ 3,636,112 1.068,356 2439,563 3,507,900 $ 1,196,569 2.439,553 3,636,112 $ 2013 2019:ProFormel 2019 Proforma2 Current labilities 524,963 S 587,859 $ 587,959 Accounts payable $ 843,094 $ 944.265 $ 944,265 Notes payable 1.235.161 $ 1,383 380 $ 1.383 380 Total current liabilities $ 2,603,218 S 2,915,604 $ 2,915,604 Long-term debt 20.381,945 $ 22.827.778 25.381.945 Shareholder equity Common stock $ Retained earnings $ Total equity $ 22.985,163 $ 25,743,383 5 28.297,549 Total abilities & equity $ 6,300,000 $ 6,300,000 $ 5 Faxed assets & Net plant 8og.pment 6,300,000 460,000 $ 460,000 460,000 $ 12.717.254 13,177,254 $ 22.985,163 $ 15,158,924 $ 14.893,295 1 Total Assets $ 25,096,036 $ 24,829,406 EFN_PF15 EFN_PF2= C D E F G 1 RetumOnAssets 2 RetumOnEquity 3 Dividend Payout Ratio # Eamings Retention Ratio 10.084% 17.589% 30.417% 69.583% s Intemal Growth Rate Sustainable Growth Rate 7.546% 13.946% DUNU Planning For Growth At S&S Air For your report, write a brief paper that answers the following questions: 1. We have calculated the internal growth rate and the sustainable growth rate for S&S Air based on the 2018 financial statements (refer to the S&S Air Excel workbook provided). Please explain the significance of each number with specific consideration to S&S Air's capital structure and its growth goal for 2019. 2. Consider pro forma 1 as a first pass at a financial plan for the next year for S&S Air. Calculate and report the EFN and discuss the financial feasibility of the company's growth plan. What are its options for meeting this EFN and which of these options look doable". Which of these options do you think is best for S&S Air? 3. Calculate the EFN under pro forma 2. Can the company meet this EFN? If we assume that S&S Air ended 2018 at 100% capacity utilization, what will happen in a general sense to capacity utilization in 2019 under scenario 2? You will need to consider the historical capital intensity ratio to help understand this question. 2 Income Statement Sales $ COGS $ Other expenses Depreciation S EBIT $ Interest expense Taxable income $ Taxos 25 Net Income $ S&S Air, Inc. 2019 ProForma1 2019.Proforma2 46,238,115 $ 51,853,889 $ 51,853,889 34,536,913 $ 38,681,343 $ 38,681,343 5,870,865 $ 6,575,369 $ 6,575,369 2.074.853 $ 2,074,853 $ 2.583.846 3,815,484 $ 4,522,324 $ 4,013,332 725.098 $ 725,09 725.099 3,090,386 $ 3,797,226 $ 3,288,234 72592S 822.058 2,317,789 $ 2.847,920 $ 2,466,175 Note: Dividends $ 5 Add to retained earnings 705,000 $ 1,612,789 $ 868,249 1,981,670 $ $ 750,134 1,716,041 2018 2019:Proforma2 8 Balance Sheet 9 Current assets O Cash Accounts receivable Inventory Total current assets 2019. ProFormat $ 1,196,569 2439.553 $ 3,636,112 1.068,356 2439,563 3,507,900 $ 1,196,569 2.439,553 3,636,112 $ 2013 2019:ProFormel 2019 Proforma2 Current labilities 524,963 S 587,859 $ 587,959 Accounts payable $ 843,094 $ 944.265 $ 944,265 Notes payable 1.235.161 $ 1,383 380 $ 1.383 380 Total current liabilities $ 2,603,218 S 2,915,604 $ 2,915,604 Long-term debt 20.381,945 $ 22.827.778 25.381.945 Shareholder equity Common stock $ Retained earnings $ Total equity $ 22.985,163 $ 25,743,383 5 28.297,549 Total abilities & equity $ 6,300,000 $ 6,300,000 $ 5 Faxed assets & Net plant 8og.pment 6,300,000 460,000 $ 460,000 460,000 $ 12.717.254 13,177,254 $ 22.985,163 $ 15,158,924 $ 14.893,295 1 Total Assets $ 25,096,036 $ 24,829,406 EFN_PF15 EFN_PF2= C D E F G 1 RetumOnAssets 2 RetumOnEquity 3 Dividend Payout Ratio # Eamings Retention Ratio 10.084% 17.589% 30.417% 69.583% s Intemal Growth Rate Sustainable Growth Rate 7.546% 13.946% DUNU Planning For Growth At S&S Air For your report, write a brief paper that answers the following questions: 1. We have calculated the internal growth rate and the sustainable growth rate for S&S Air based on the 2018 financial statements (refer to the S&S Air Excel workbook provided). Please explain the significance of each number with specific consideration to S&S Air's capital structure and its growth goal for 2019. 2. Consider pro forma 1 as a first pass at a financial plan for the next year for S&S Air. Calculate and report the EFN and discuss the financial feasibility of the company's growth plan. What are its options for meeting this EFN and which of these options look doable". Which of these options do you think is best for S&S Air? 3. Calculate the EFN under pro forma 2. Can the company meet this EFN? If we assume that S&S Air ended 2018 at 100% capacity utilization, what will happen in a general sense to capacity utilization in 2019 under scenario 2? You will need to consider the historical capital intensity ratio to help understand this


