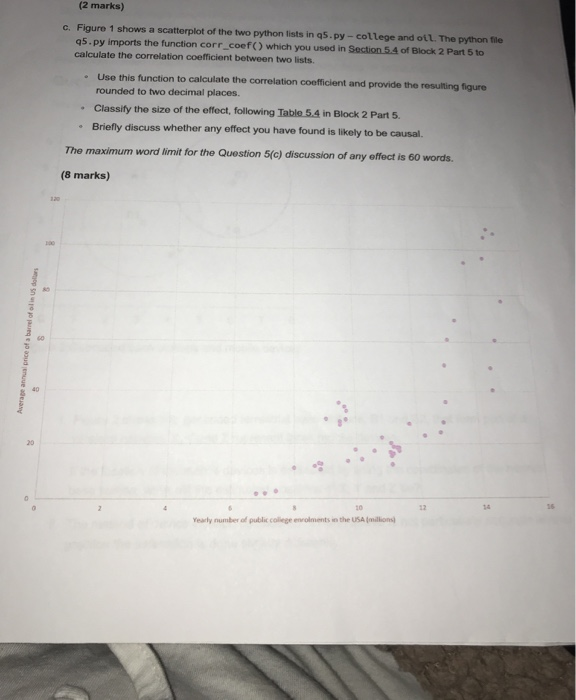
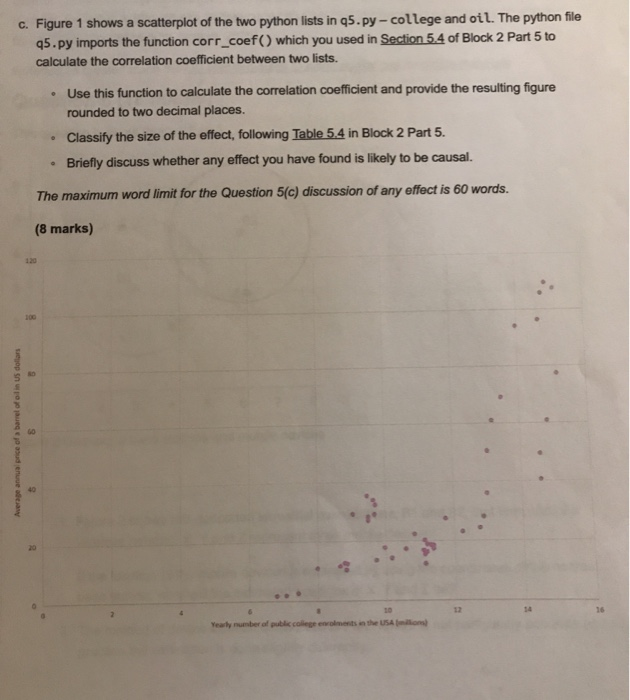
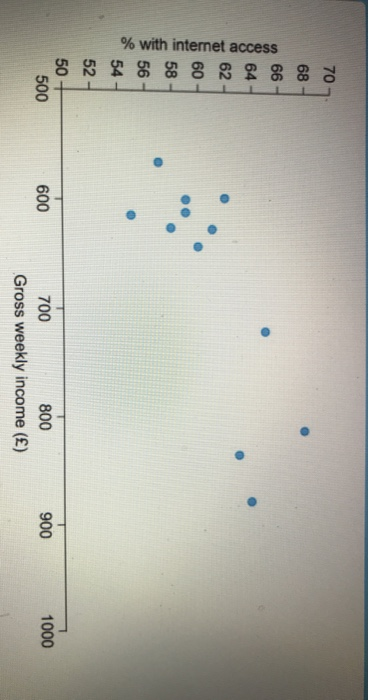
(2 marks) c. Figure 1 shows a scatterplot of the two python lists in 95.py - college and out. The python tile 95.py imports the function corr_coef() which you used in Section 5.4 of Block 2 Part 5 to calculate the correlation coefficient between two lists. Use this function to calculate the correlation coefficient and provide the resulting figure rounded to two decimal places Classify the size of the effect, following Table 5.4 in Block 2 Part 5 Briefly discuss whether any effect you have found is likely to be causal The maximum word limit for the Question 5(c) discussion of any effect is 60 words. (8 marks) Aerofoto the UA c. Figure 1 shows a scatterplot of the two python lists in 95.py - college and oil. The python file 45.py imports the function corr_coef() which you used in Section 5.4 of Block 2 Part 5 to calculate the correlation coefficient between two lists. Use this function to calculate the correlation coefficient and provide the resulting figure rounded to two decimal places. Classify the size of the effect, following Table 5.4 in Block 2 Part 5. Briefly discuss whether any effect you have found is likely to be causal. The maximum word limit for the Question 5(c) discussion of any effect is 60 words. (8 marks) Average annual price of barrel of olin US dollars Yearly number of public college erments in the USA % with internet access Li 50+ 500 600 900 1000 700 800 Gross weekly income () (2 marks) c. Figure 1 shows a scatterplot of the two python lists in 95.py - college and out. The python tile 95.py imports the function corr_coef() which you used in Section 5.4 of Block 2 Part 5 to calculate the correlation coefficient between two lists. Use this function to calculate the correlation coefficient and provide the resulting figure rounded to two decimal places Classify the size of the effect, following Table 5.4 in Block 2 Part 5 Briefly discuss whether any effect you have found is likely to be causal The maximum word limit for the Question 5(c) discussion of any effect is 60 words. (8 marks) Aerofoto the UA c. Figure 1 shows a scatterplot of the two python lists in 95.py - college and oil. The python file 45.py imports the function corr_coef() which you used in Section 5.4 of Block 2 Part 5 to calculate the correlation coefficient between two lists. Use this function to calculate the correlation coefficient and provide the resulting figure rounded to two decimal places. Classify the size of the effect, following Table 5.4 in Block 2 Part 5. Briefly discuss whether any effect you have found is likely to be causal. The maximum word limit for the Question 5(c) discussion of any effect is 60 words. (8 marks) Average annual price of barrel of olin US dollars Yearly number of public college erments in the USA % with internet access Li 50+ 500 600 900 1000 700 800 Gross weekly income ()


