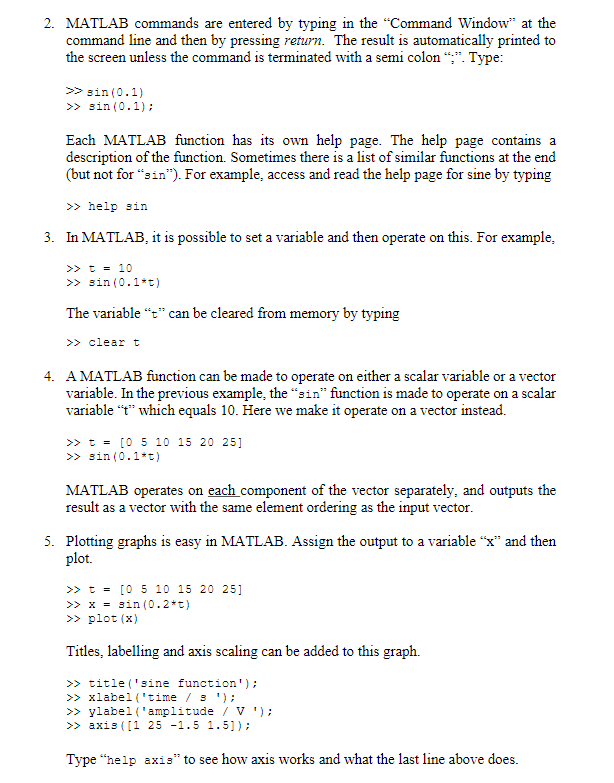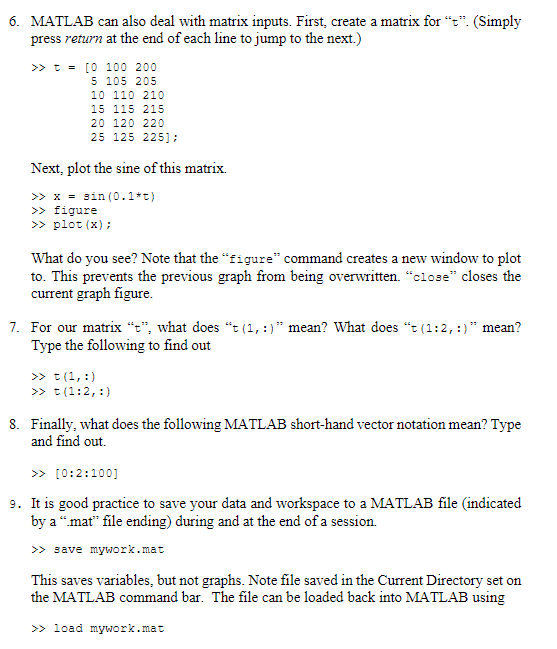


2. MATLAB commands are entered by typing in the "Command Window" at the command line and then by pressing return. The result is automatically printed to the screen unless the command is terminated with a semi colon""". Type: >> gin(0.1) >> sin(0.1); Each MATLAB function has its own help page. The help page contains a description of the function. Sometimes there is a list of similar functions at the end (but not for zin). For example, access and read the help page for sine by typing >> help sin 3. In MATLAB, it is possible to set a variable and then operate on this. For example, >> t = 10 >> sin(0.1*1) The variable "t" can be cleared from memory by typing >> clear t 4. A MATLAB function can be made to operate on either a scalar variable or a vector variable. In the previous example, the "sin" function is made to operate on a scalar variable "4" which equals 10. Here we make it operate on a vector instead. >> = = [0 5 10 15 20 25] >> sin(0.1*t) MATLAB operates on each component of the vector separately, and outputs the result as a vector with the same element ordering as the input vector. 5. Plotting graphs is easy in MATLAB. Assign the output to a variable "x" and then plot. >> = = [0 5 10 15 20 25] >> x = sin(0.2*t) >> plot (x) Titles, labelling and axis scaling can be added to this graph. >> title('sine function'); >> xlabel('time / 9'); >> ylabel('amplitude / V'); >> axis ((1 25 -1.5 1.5]); Type "help axis" to see how axis works and what the last line above does. 6. MATLAB can also deal with matrix inputs. First, create a matrix for "=" (Simply press return at the end of each line to jump to the next.) >> t = [0 100 200 5 105 205 10 110 210 15 115 215 20 120 220 25 125 225]; Next, plot the sine of this matrix. >> x = sin(0.1*t) >> figure >> plot (x); What do you see? Note that the "figure" command creates a new window to plot to. This prevents the previous graph from being overwritten. "close" closes the current graph figure 7. For our matrix , what does t(1,:)" mean? What does "=(1:2, :)" mean? Type the following to find out >> 1(1,:) >> +(1:2, :) 8. Finally, what does the following MATLAB short-hand vector notation mean? Type and find out. >> [0:2:100] 9. It is good practice to save your data and workspace to a MATLAB file (indicated by a mat file ending) during and at the end of a session. >> save mywork.mat This saves variables, but not graphs. Note file saved in the Current Directory set on the MATLAB command bar. The file can be loaded back into MATLAB using Load mywark.net Section 2: Getting Started with MATLAB Work through this section, task-by-task. Answer any questions which are asked and write the answers neatly. (Remember that no screen printouts of graphs are needed for this section) 1. Activate MATLAB by double-clicking on the icon. MATLAB takes a while to fully initialise, so please wait. Three windows are displayed. The top-left is the "Workspace" window, the bottom-left shows the "Command History", and the right-hand window is the "Command Window


