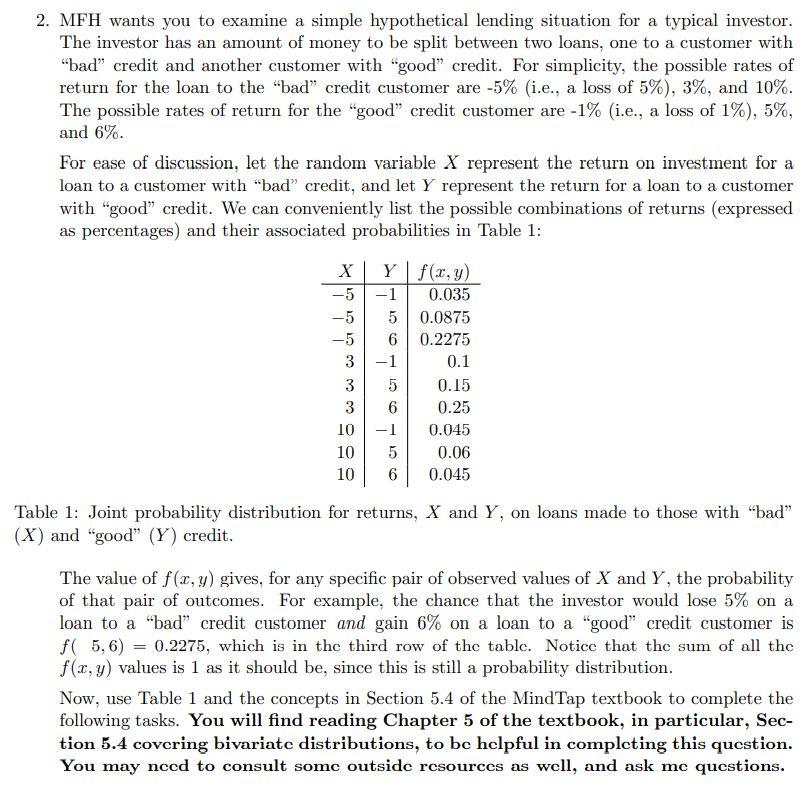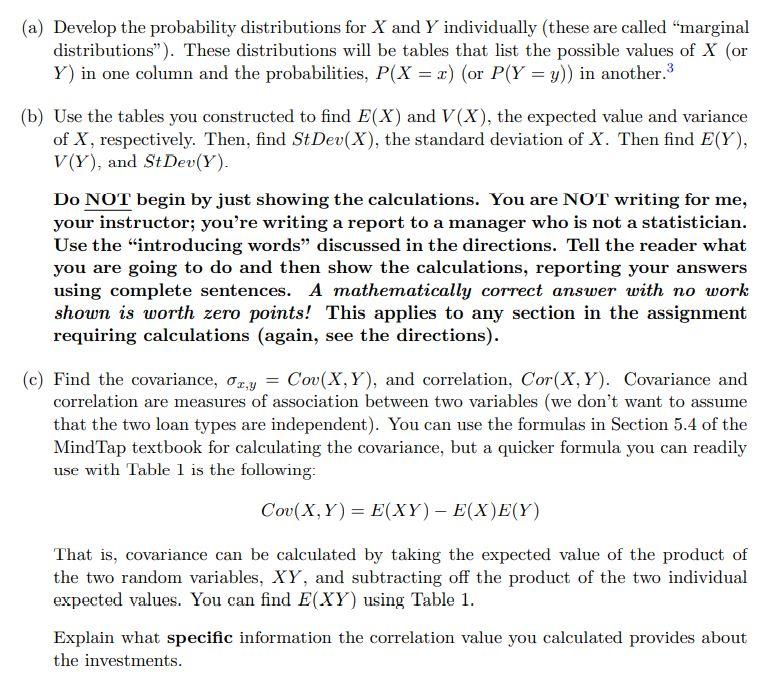

2. MFH wants you to examine a simple hypothetical lending situation for a typical investor. The investor has an amount of money to be split between two loans, one to a customer with "bad" credit and another customer with "good" credit. For simplicity, the possible rates of return for the loan to the "bad" credit customer are -5% (i.e., a loss of 5%), 3%, and 10%. The possible rates of return for the "good" credit customer are -1% (i.e., a loss of 1%), 5%, and 6%. For ease of discussion, let the random variable X represent the return on investment for a loan to a customer with "bad" credit, and let y represent the return for a loan to a customer with "good" credit. We can conveniently list the possible combinations of returns (expressed as percentages) and their associated probabilities in Table 1: X -5 -5 3 3 3 10 10 10 Yf(x, y) -1 0.035 5 0.0875 6 0.2275 -1 0.1 5 0.15 6 0.25 -1 0.045 5 0.06 6 0.045 Table 1: Joint probability distribution for returns, X and Y , on loans made to those with "bad" (X) and "good" (Y) credit. The value of f(x,y) gives, for any specific pair of observed values of X and Y, the probability of that pair of outcomes. For example, the chance that the investor would lose 5% on a loan to a "bad" credit customer and gain 6% on a loan to a "good" credit customer is f( 5, 6) = 0.2275, which is in the third row of the table. Notice that the sum of all the f(x,y) values is 1 as it should be, since this is still a probability distribution. Now, use Table 1 and the concepts in Section 5.4 of the MindTap textbook to complete the following tasks. You will find reading Chapter 5 of the textbook, in particular, Sec- tion 5.4 covering bivariate distributions, to be helpful in completing this question. You may need to consult some outside resources as well, and ask me questions. (a) Develop the probability distributions for X and Y individually (these are called "marginal distributions). These distributions will be tables that list the possible values of X (or Y) in one column and the probabilities, P(X = 2) (or P(Y = y)) in another. (b) Use the tables you constructed to find E(X) and V(X), the expected value and variance of X, respectively. Then, find St Dev(X), the standard deviation of X. Then find E(Y), V(Y), and St Dev(Y). Do NOT begin by just showing the calculations. You are NOT writing for me, your instructor; you're writing a report to a manager who is not a statistician. Use the "introducing words discussed in the directions. Tell the reader what you are going to do and then show the calculations, reporting your answers using complete sentences. A mathematically correct answer with no work shown is worth zero points! This applies to any section in the assignment requiring calculations (again, see the directions). (c) Find the covariance, Ox.y = Cou(X,Y), and correlation, Cor(X,Y). Covariance and correlation are measures of association between two variables (we don't want to assume that the two loan types are independent). You can use the formulas in Section 5.4 of the MindTap textbook for calculating the covariance, but a quicker formula you can readily use with Table 1 is the following: Cov(X,Y) = E(XY) - E(X)E(Y) That is, covariance can be calculated by taking the expected value of the product of the two random variables, XY, and subtracting off the product of the two individual expected values. You can find E(XY) using Table 1. Explain what specific information the correlation value you calculated provides about the investments. 2. MFH wants you to examine a simple hypothetical lending situation for a typical investor. The investor has an amount of money to be split between two loans, one to a customer with "bad" credit and another customer with "good" credit. For simplicity, the possible rates of return for the loan to the "bad" credit customer are -5% (i.e., a loss of 5%), 3%, and 10%. The possible rates of return for the "good" credit customer are -1% (i.e., a loss of 1%), 5%, and 6%. For ease of discussion, let the random variable X represent the return on investment for a loan to a customer with "bad" credit, and let y represent the return for a loan to a customer with "good" credit. We can conveniently list the possible combinations of returns (expressed as percentages) and their associated probabilities in Table 1: X -5 -5 3 3 3 10 10 10 Yf(x, y) -1 0.035 5 0.0875 6 0.2275 -1 0.1 5 0.15 6 0.25 -1 0.045 5 0.06 6 0.045 Table 1: Joint probability distribution for returns, X and Y , on loans made to those with "bad" (X) and "good" (Y) credit. The value of f(x,y) gives, for any specific pair of observed values of X and Y, the probability of that pair of outcomes. For example, the chance that the investor would lose 5% on a loan to a "bad" credit customer and gain 6% on a loan to a "good" credit customer is f( 5, 6) = 0.2275, which is in the third row of the table. Notice that the sum of all the f(x,y) values is 1 as it should be, since this is still a probability distribution. Now, use Table 1 and the concepts in Section 5.4 of the MindTap textbook to complete the following tasks. You will find reading Chapter 5 of the textbook, in particular, Sec- tion 5.4 covering bivariate distributions, to be helpful in completing this question. You may need to consult some outside resources as well, and ask me questions. (a) Develop the probability distributions for X and Y individually (these are called "marginal distributions). These distributions will be tables that list the possible values of X (or Y) in one column and the probabilities, P(X = 2) (or P(Y = y)) in another. (b) Use the tables you constructed to find E(X) and V(X), the expected value and variance of X, respectively. Then, find St Dev(X), the standard deviation of X. Then find E(Y), V(Y), and St Dev(Y). Do NOT begin by just showing the calculations. You are NOT writing for me, your instructor; you're writing a report to a manager who is not a statistician. Use the "introducing words discussed in the directions. Tell the reader what you are going to do and then show the calculations, reporting your answers using complete sentences. A mathematically correct answer with no work shown is worth zero points! This applies to any section in the assignment requiring calculations (again, see the directions). (c) Find the covariance, Ox.y = Cou(X,Y), and correlation, Cor(X,Y). Covariance and correlation are measures of association between two variables (we don't want to assume that the two loan types are independent). You can use the formulas in Section 5.4 of the MindTap textbook for calculating the covariance, but a quicker formula you can readily use with Table 1 is the following: Cov(X,Y) = E(XY) - E(X)E(Y) That is, covariance can be calculated by taking the expected value of the product of the two random variables, XY, and subtracting off the product of the two individual expected values. You can find E(XY) using Table 1. Explain what specific information the correlation value you calculated provides about the investments


