

Question
2: MULTIPLE REGRESSION In a study, 210 healthy elderly adults (ages 55 to 85) were recruited and randomized to one of three groups (n=70 per
2: MULTIPLE REGRESSION
In a study, 210 healthy elderly adults (ages 55 to 85) were recruited and randomized to one of three groups (n=70 per group).
The Control group agreed to be evaluated but were not assigned to any intervention program.
The Walking group (aerobic exercise) walked three days a week for 40 minutes.
The Yoga group (yoga and toning exercises, which are non-aerobic exercise) participated in group yoga sessions 3 days a week.
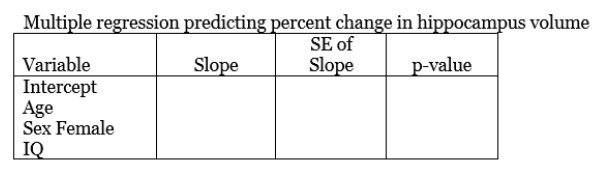
Magnetic resonance imaging (MRI) was used to measure the volume of the hippocampus at study baseline and then again after 1 year. The dependent variable for this study is the percent change in hippocampus volume, where positive change values indicate an increase in hippocampus volume (e.g., 1.3 indicates a 1.3% increase in volume) and negative change values indicate a reduction in hippocampus volume (e.g., -1.7 indicates a 1.7% decrease in volume). Our primary study question is whether those who exercised had less decline in hippocampus volume than those in the control group.
Data for this study are saved in the attached 'Elders file located here: https://docs.google.com/spreadsheets/d/1ZjrtwsOwkJ3uT5aENWuWIXEAOmmUqvjSK3obej8NZ_U/edit?usp=sharing
Variables in the data set are:
1.subjid, an id number ranging from 1 to 210;
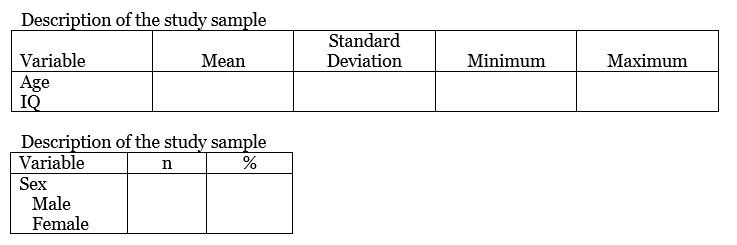
2.age, in years, restricted to adults between the ages of 55 and 85;
3.sexf, coded 1 for females and 0 for males;
4.IQ, measured at the start of the study, as a general measure of cognitive ability, the mean IQ is expected to be around 100;
5.exercise, coded 1 for those in the Control group, 2 for those in the Walking group, and 3 for those in the Yoga group;
6.hippochange, the percent change in the hippocampus volume, which should range roughly between -4 percent (indicating a 4% decrease in volume) and 4 percent (indicating a 4% increase in volume).
#A .
Step by Step Solution
There are 3 Steps involved in it
Step: 1

Get Instant Access to Expert-Tailored Solutions
See step-by-step solutions with expert insights and AI powered tools for academic success
Step: 2

Step: 3
Ace Your Homework with AI
Get the answers you need in no time with our AI-driven, step-by-step assistance
Get Started
Algebra And Trigonometry Enhanced With Graphing Utilities (Subscription)
Authors: Michael, Michael Sullivan III, Michael III Sullivan, Michael Sullivan 111, III Sullivan
6th Edition
0321849132, 9780321849137