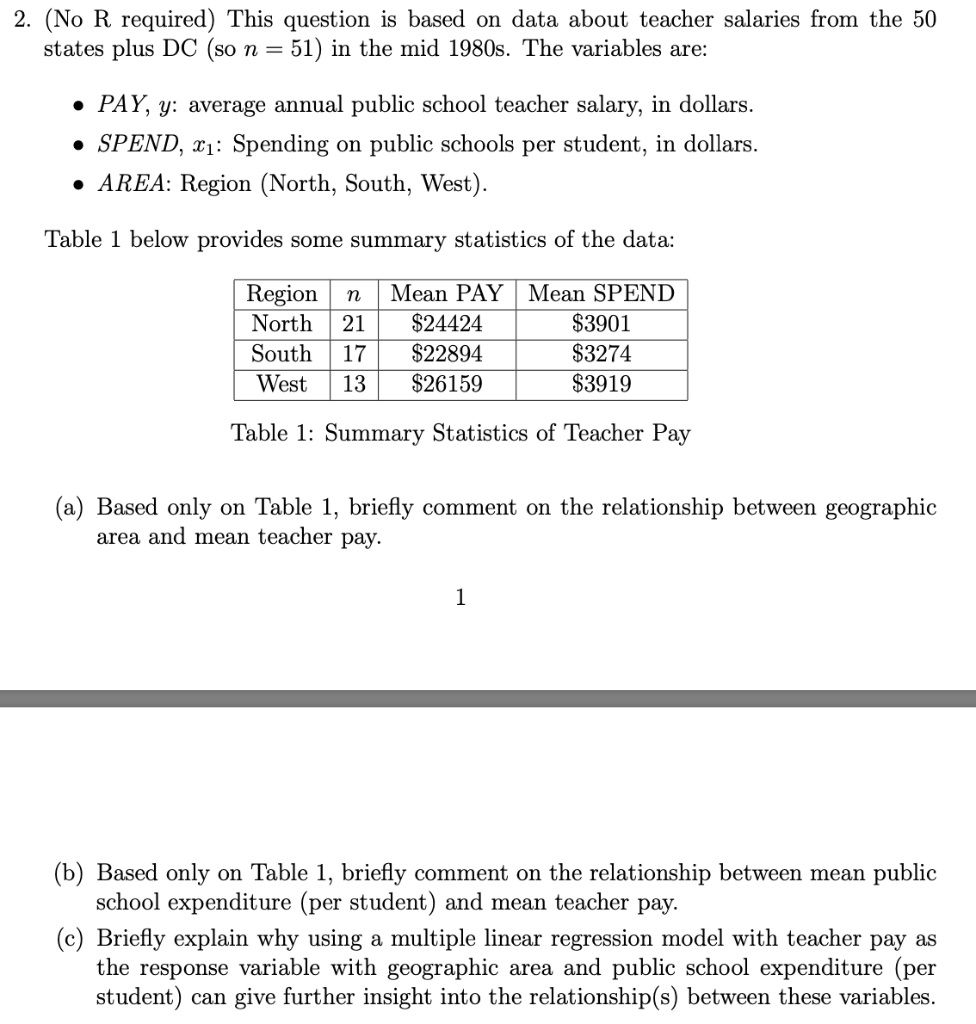
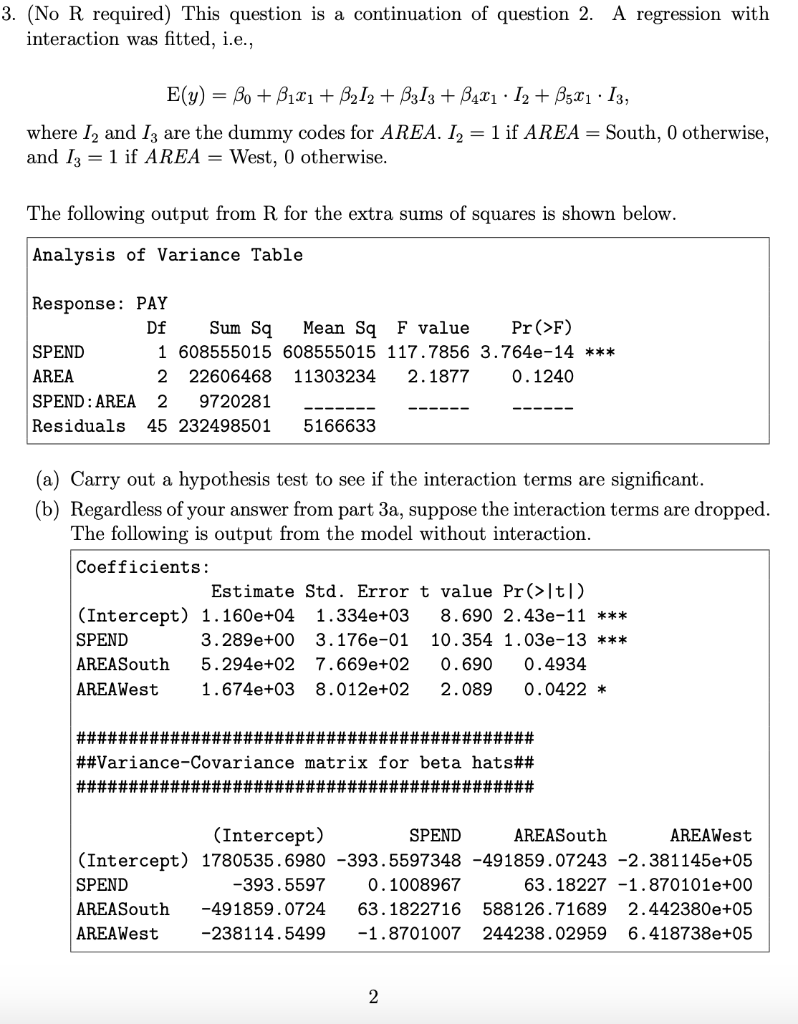
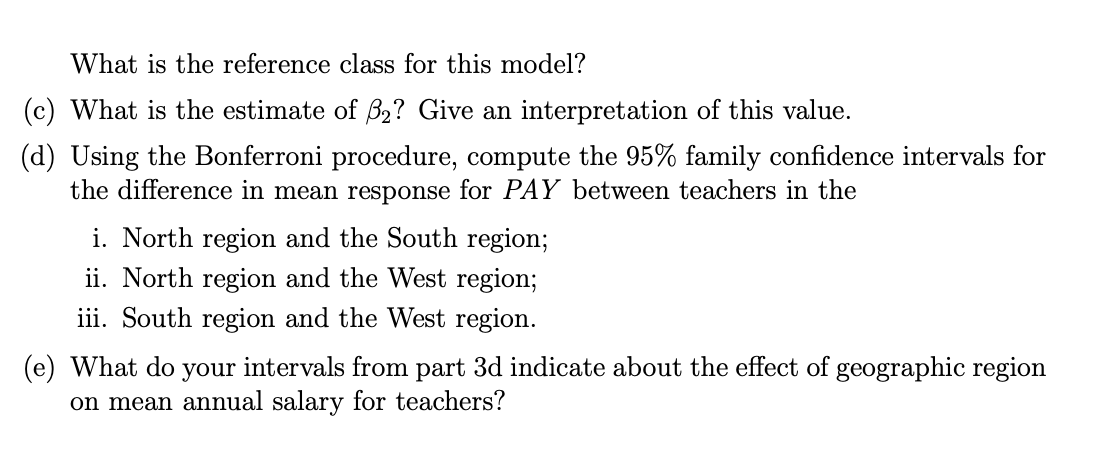
2. (No R required) This question is based on data about teacher salaries from the 50 states plus DC (so n = 51) in the mid 1980s. The variables are: PAY, y: average annual public school teacher salary, in dollars. SPEND, x: Spending on public schools per student, in dollars. AREA: Region (North, South, West). Table 1 below provides some summary statistics of the data: Region North South West n 21 17 13 Mean PAY $24424 $22894 $26159 Mean SPEND $3901 $3274 $3919 Table 1: Summary Statistics of Teacher Pay (a) Based only on Table 1, briefly comment on the relationship between geographic area and mean teacher pay. 1 Based only on Table 1, briefly comment on the rela hip between mean public school expenditure (per student) and mean teacher pay. (c) Briefly explain why using a multiple linear regression model with teacher pay as the response variable with geographic area and public school expenditure (per student) can give further insight into the relationship(s) between these variables. 3. (No R required) This question is a continuation of question 2. A regression with interaction was fitted, i.e., E(y) = Bo + B121 + B212 + B313 + B471 12 + 3521 13, where I and Iz are the dummy codes for AREA. I2 = 1 if AREA = South, 0 otherwise, and 13 = 1 if AREA = West, 0 otherwise. The following output from R for the extra sums of squares is shown below. Analysis of Variance Table Sum Sq Response: PAY Df Mean Sq F value Pr>F) SPEND 1 608555015 608555015 117.7856 3.764e-14 *** AREA 2 22606468 11303234 2.1877 0.1240 SPEND: AREA 2 9720281 Residuals 45 232498501 5166633 (a) Carry out a hypothesis test to see if the interaction terms are significant. (b) Regardless of your answer from part 3a, suppose the interaction terms are dropped. The following is output from the model without interaction. Coefficients: Estimate Std. Error t value Pr(>t) (Intercept) 1.160e+04 1.334e+03 8.690 2.43e-11 *** SPEND 3.289e+00 3.176e-01 10.354 1.03e-13 *** AREASouth 5.294e+02 7.669e+02 0.690 0.4934 AREAWest 1.674e+03 8.012e+02 2.089 0.0422 * ############################################ ##Variance-Covariance matrix for beta hats## ############################################ (Intercept) SPEND AREASouth AREAWest (Intercept) 1780535.6980 -393.5597348 -491859.07243 -2.381145e+05 SPEND -393.5597 0.1008967 63.18227 -1.870101e+00 AREA South -491859.0724 63.1822716 588126.71689 2.442380e+05 AREAWest -238114.5499 -1.8701007 244238.02959 6.418738e+05 2 What is the reference class for this model? (c) What is the estimate of B2? Give an interpretation of this value. (d) Using the Bonferroni procedure, compute the 95% family confidence intervals for the difference in mean response for PAY between teachers in the i. North region and the South region; ii. North region and the West region; iii. South region and the West region. (e) What do your intervals from part 3d indicate about the effect of geographic region on mean annual salary for teachers? 2. (No R required) This question is based on data about teacher salaries from the 50 states plus DC (so n = 51) in the mid 1980s. The variables are: PAY, y: average annual public school teacher salary, in dollars. SPEND, x: Spending on public schools per student, in dollars. AREA: Region (North, South, West). Table 1 below provides some summary statistics of the data: Region North South West n 21 17 13 Mean PAY $24424 $22894 $26159 Mean SPEND $3901 $3274 $3919 Table 1: Summary Statistics of Teacher Pay (a) Based only on Table 1, briefly comment on the relationship between geographic area and mean teacher pay. 1 Based only on Table 1, briefly comment on the rela hip between mean public school expenditure (per student) and mean teacher pay. (c) Briefly explain why using a multiple linear regression model with teacher pay as the response variable with geographic area and public school expenditure (per student) can give further insight into the relationship(s) between these variables. 3. (No R required) This question is a continuation of question 2. A regression with interaction was fitted, i.e., E(y) = Bo + B121 + B212 + B313 + B471 12 + 3521 13, where I and Iz are the dummy codes for AREA. I2 = 1 if AREA = South, 0 otherwise, and 13 = 1 if AREA = West, 0 otherwise. The following output from R for the extra sums of squares is shown below. Analysis of Variance Table Sum Sq Response: PAY Df Mean Sq F value Pr>F) SPEND 1 608555015 608555015 117.7856 3.764e-14 *** AREA 2 22606468 11303234 2.1877 0.1240 SPEND: AREA 2 9720281 Residuals 45 232498501 5166633 (a) Carry out a hypothesis test to see if the interaction terms are significant. (b) Regardless of your answer from part 3a, suppose the interaction terms are dropped. The following is output from the model without interaction. Coefficients: Estimate Std. Error t value Pr(>t) (Intercept) 1.160e+04 1.334e+03 8.690 2.43e-11 *** SPEND 3.289e+00 3.176e-01 10.354 1.03e-13 *** AREASouth 5.294e+02 7.669e+02 0.690 0.4934 AREAWest 1.674e+03 8.012e+02 2.089 0.0422 * ############################################ ##Variance-Covariance matrix for beta hats## ############################################ (Intercept) SPEND AREASouth AREAWest (Intercept) 1780535.6980 -393.5597348 -491859.07243 -2.381145e+05 SPEND -393.5597 0.1008967 63.18227 -1.870101e+00 AREA South -491859.0724 63.1822716 588126.71689 2.442380e+05 AREAWest -238114.5499 -1.8701007 244238.02959 6.418738e+05 2 What is the reference class for this model? (c) What is the estimate of B2? Give an interpretation of this value. (d) Using the Bonferroni procedure, compute the 95% family confidence intervals for the difference in mean response for PAY between teachers in the i. North region and the South region; ii. North region and the West region; iii. South region and the West region. (e) What do your intervals from part 3d indicate about the effect of geographic region on mean annual salary for teachers