Answered step by step
Verified Expert Solution
Link Copied!

Question

1 Approved Answer

2 of 3 ID: MST.FET.R.SLRM.02.0010A [4 marks] A regression model has been developed to analyze the relationship between a response variable Y and an explanatory
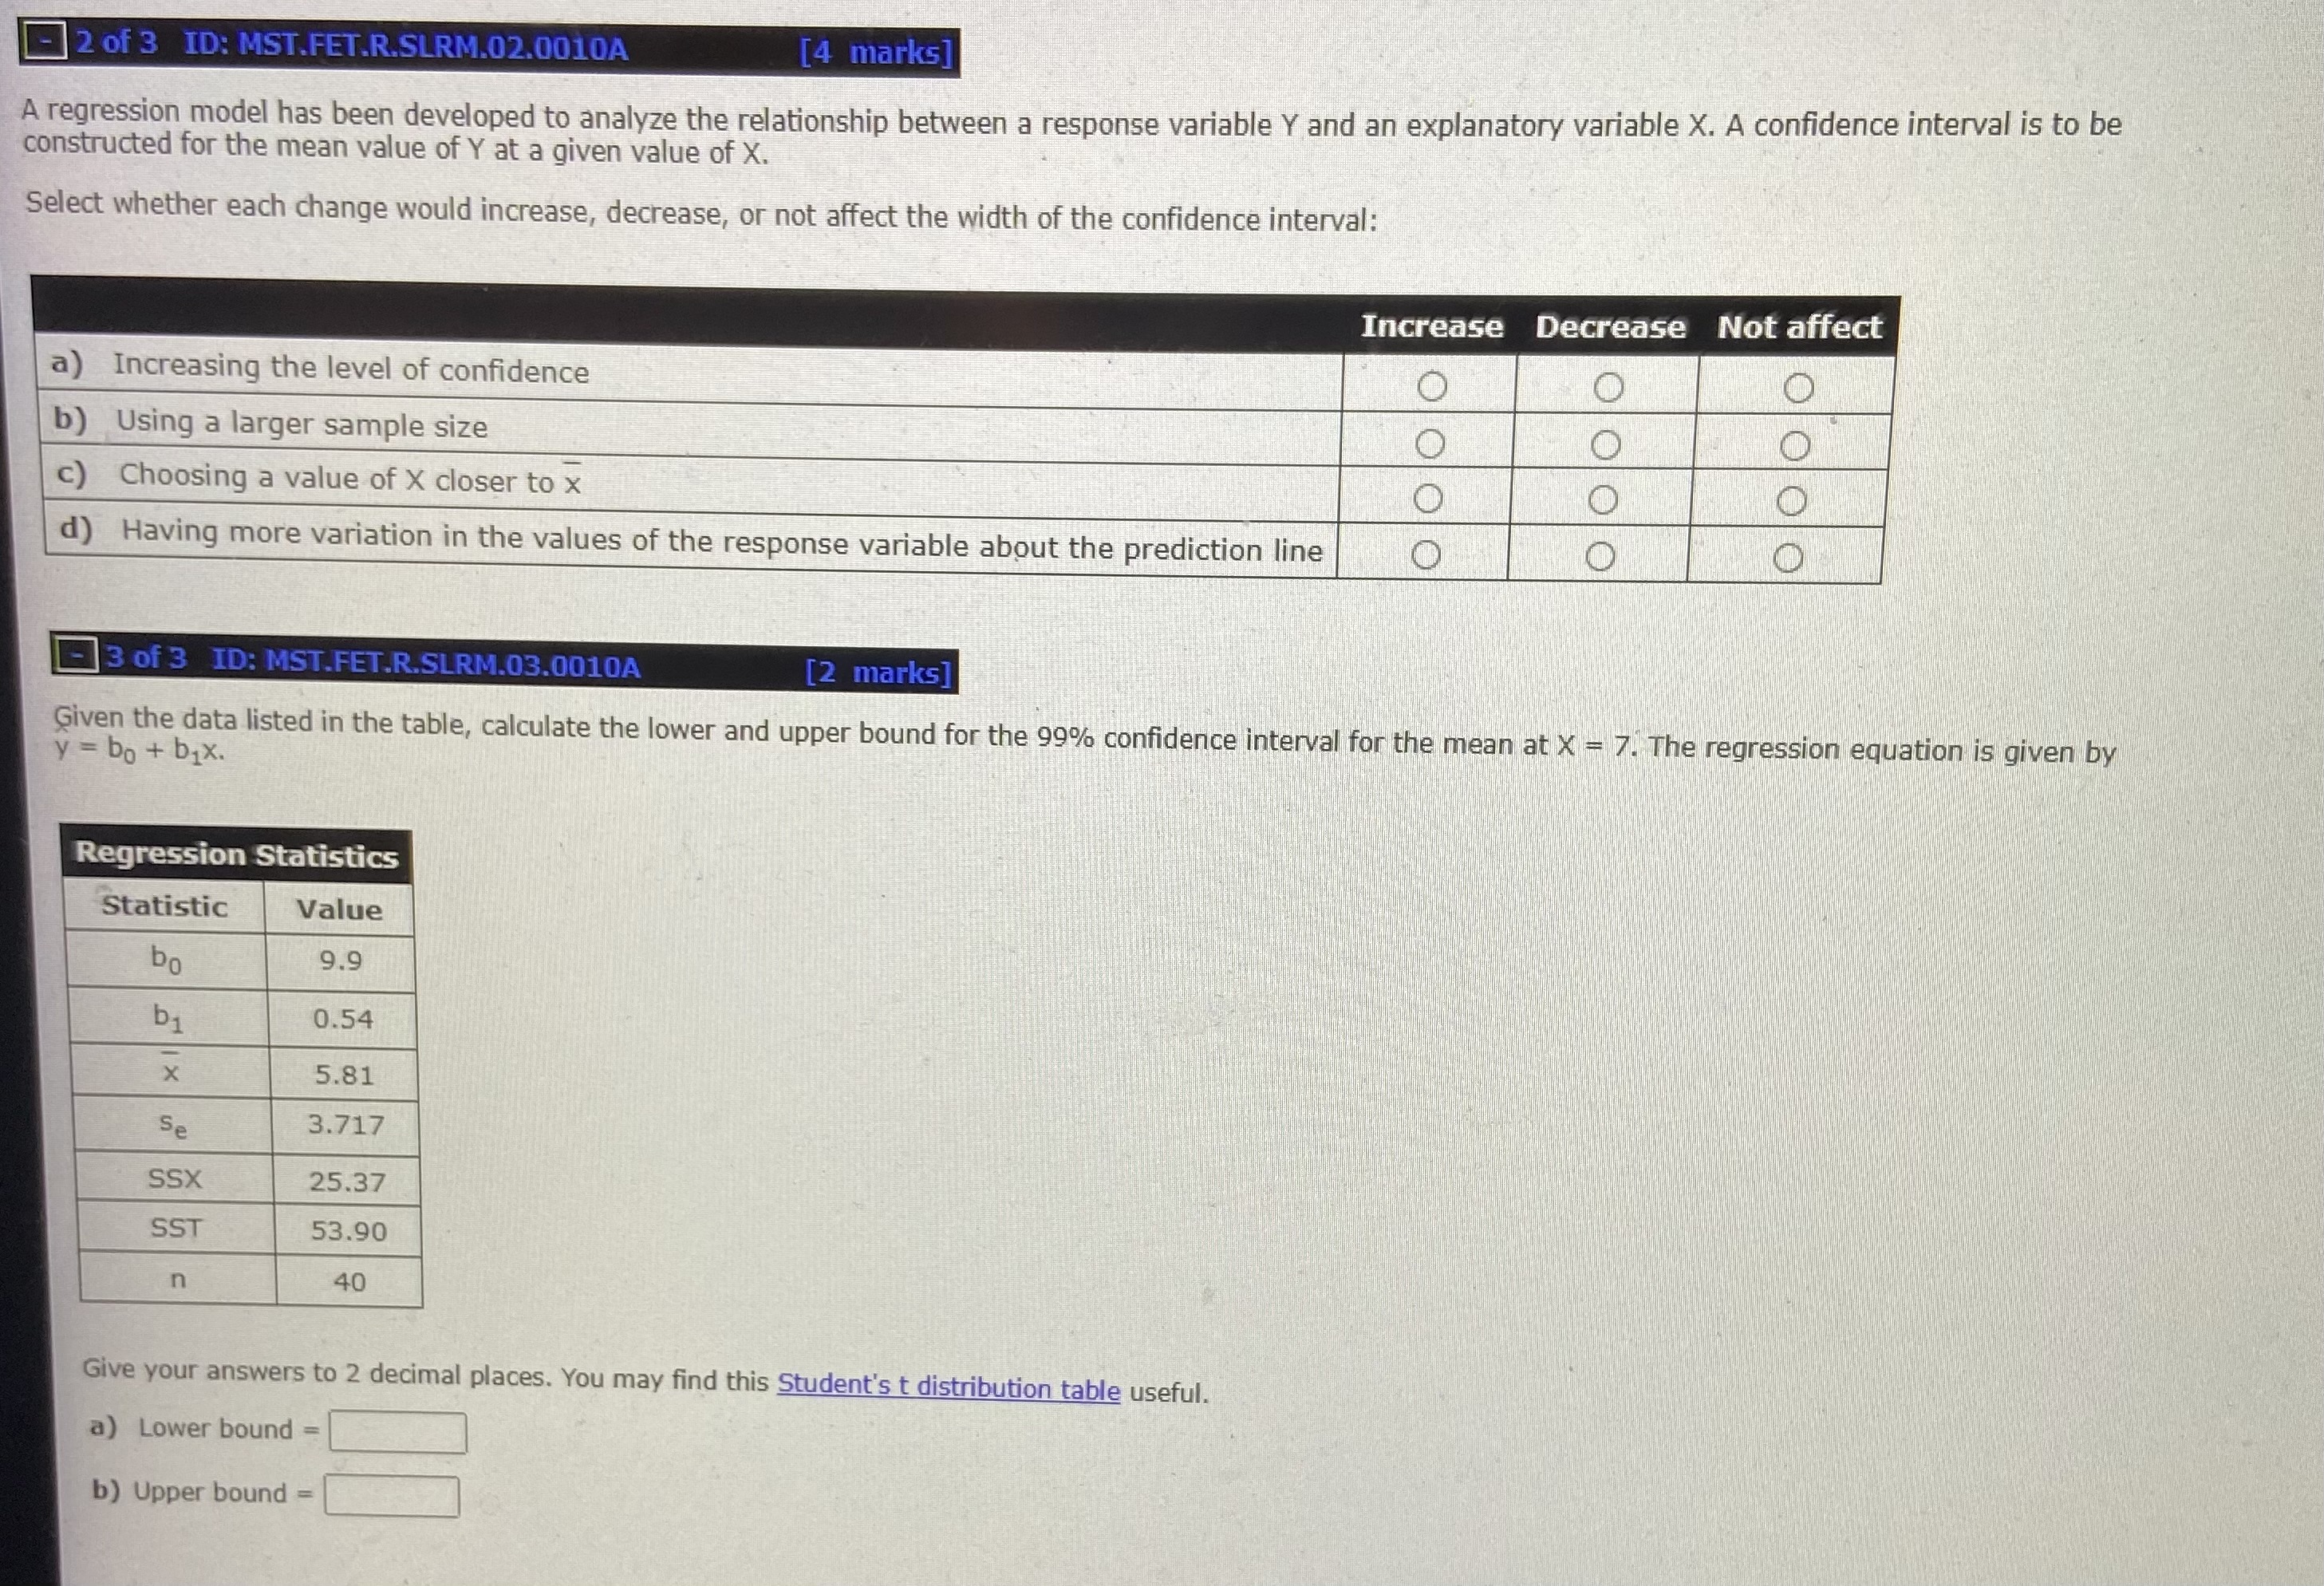
image text in transcribed
2 of 3 ID: MST.FET.R.SLRM.02.0010A [4 marks] A regression model has been developed to analyze the relationship between a response variable Y and an explanatory variable X. A confidence interval is to be constructed for the mean value of Y at a given value of X. Select whether each change would increase, decrease, or not affect the width of the confidence interval: Increase Decrease Not affect a) Increasing the level of confidence O O O b) Using a larger sample size O c) Choosing a value of X closer to x O O O d) Having more variation in the values of the response variable about the prediction line O O O 3 of 3 ID: MST.FET.R.SLRM.03.0010A [2 marks Given the data listed in the table, calculate the lower and upper bound for the 99% confidence interval for the mean at X - 7. The regression equation is given by y = bo + bix. Regression Statistics Statistic Value bo 9.9 b1 0.54 X 5.81 Se 3.717 SSX 25.37 SST 53.90 n 40 Give your answers to 2 decimal places. You may find this Student's t distribution table useful. a) Lower bound = b) Upper bound =

Step by Step Solution

There are 3 Steps involved in it

Step: 1

blur-text-image

Get Instant Access to Expert-Tailored Solutions

See step-by-step solutions with expert insights and AI powered tools for academic success

Step: 2

blur-text-image

Step: 3

blur-text-image

Ace Your Homework with AI

Get the answers you need in no time with our AI-driven, step-by-step assistance

Get Started

Recommended Textbook for

Finite Math And Applied Calculus

Authors: Stefan Waner, Steven Costenoble

2nd Edition

0534366309, 9780534366308

More Books

Students also viewed these Mathematics questions