

Answered step by step
Verified Expert Solution
Question
1 Approved Answer
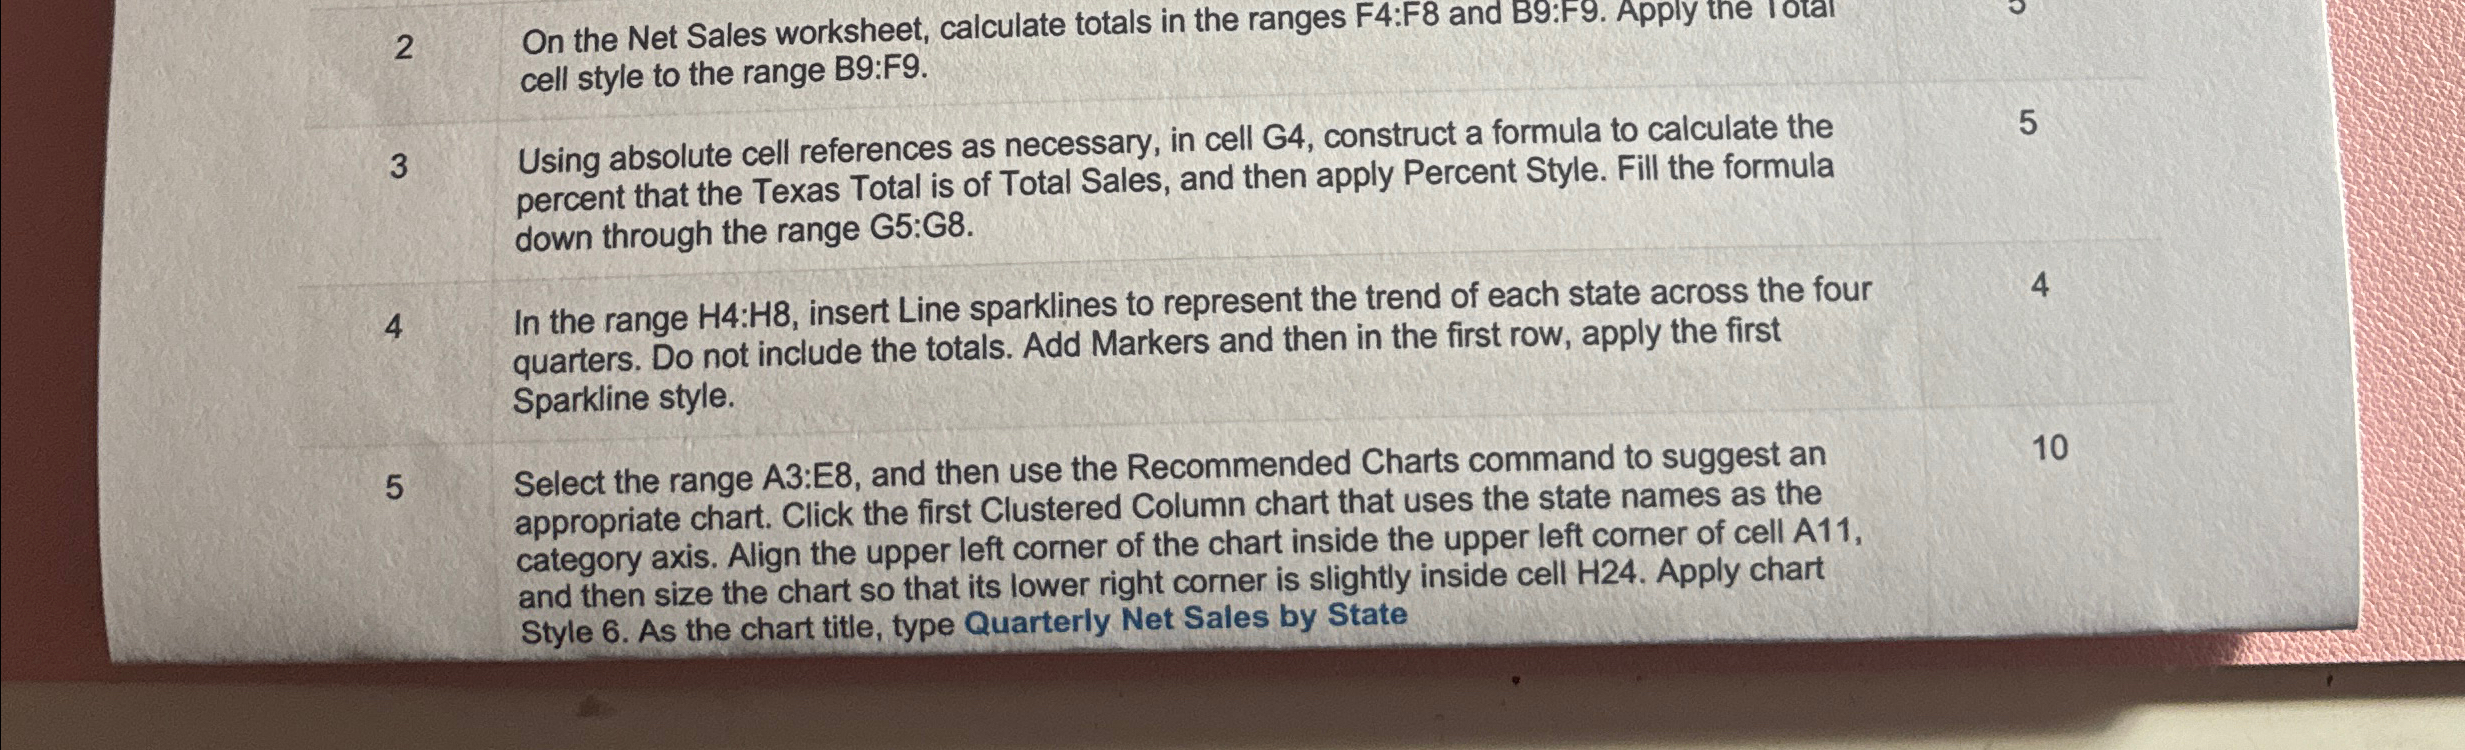
2 On the Net Sales worksheet, calculate totals in the ranges F 4 :F 8 and B 9 :F 9 . Apply the Lotal cell
On the Net Sales worksheet, calculate totals in the ranges F:F and B:F Apply the Lotal cell style to the range B:F
Using absolute cell references as necessary, in cell G construct a formula to calculate the
percent that the Texas Total is of Total Sales, and then apply Percent Style. Fill the formula down through the range :
In the range : insert Line sparklines to represent the trend of each state across the four quarters. Do not include the totals. Add Markers and then in the first row, apply the first Sparkline style.
Select the range : and then use the Recommended Charts command to suggest an
appropriate chart. Click the first Clustered Column chart that uses the state names as the category axis. Align the upper left corner of the chart inside the upper left comer of cell A and then size the chart so that its lower right corner is slightly inside cell Apply chart Style As the chart title, type Quarterly Net Sales by State
Step by Step Solution
There are 3 Steps involved in it
Step: 1

Get Instant Access to Expert-Tailored Solutions
See step-by-step solutions with expert insights and AI powered tools for academic success
Step: 2

Step: 3
Ace Your Homework with AI
Get the answers you need in no time with our AI-driven, step-by-step assistance
Get Started
Secrets Of Analytical Leaders Insights From Information Insiders
Authors: Wayne Eckerson
1st Edition
1935504347, 9781935504344