

Question
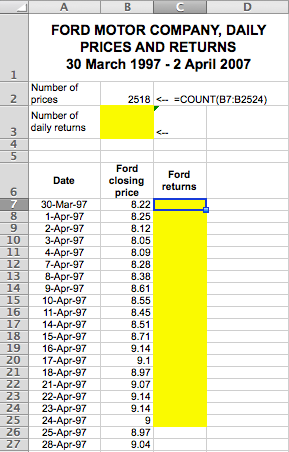
2. On the spreadsheet with these problems there is a sheet with 10 years of daily stock prices for Ford Corporation. Graph the daily returns
2. On the spreadsheet with these problems there is a sheet with 10 years of daily stock prices for Ford Corporation.
Graph the daily returns & Compute their frequency distribution.
Please add forumlas
Step by Step Solution
There are 3 Steps involved in it
Step: 1

Get Instant Access to Expert-Tailored Solutions
See step-by-step solutions with expert insights and AI powered tools for academic success
Step: 2

Step: 3
Ace Your Homework with AI
Get the answers you need in no time with our AI-driven, step-by-step assistance
Get Started
Financial Management Principles And Applications
Authors: Arthur J. Keown, J. William Petty, John D. Martin, Jr. Scott, David F.
10th Edition
0131450654, 9780131450653