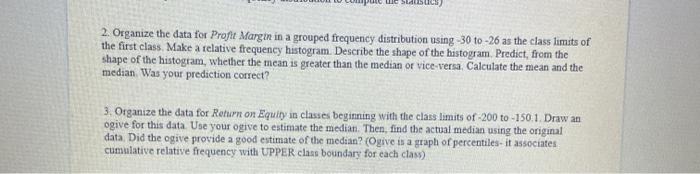
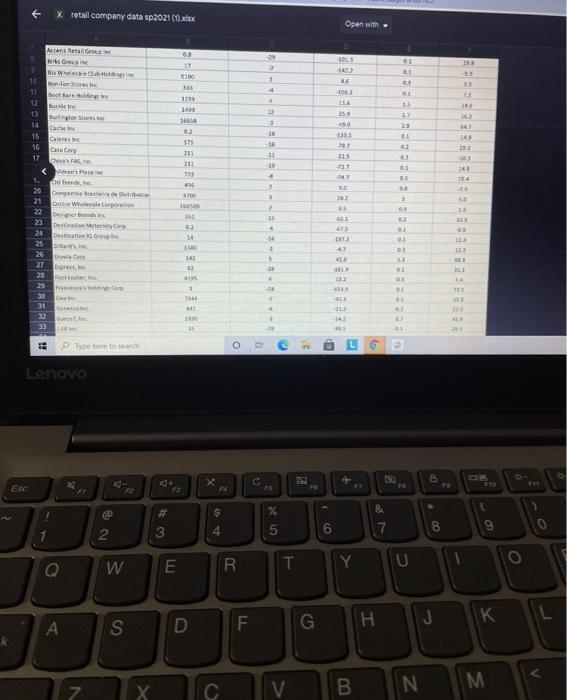
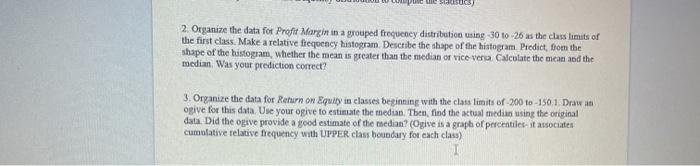
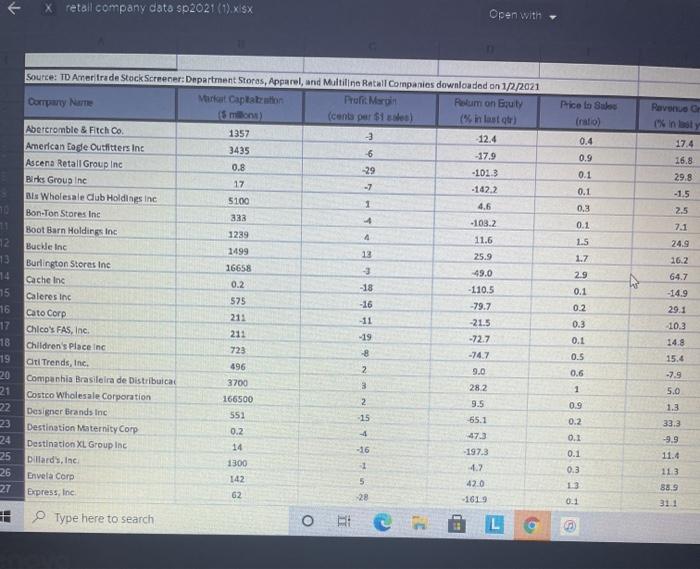
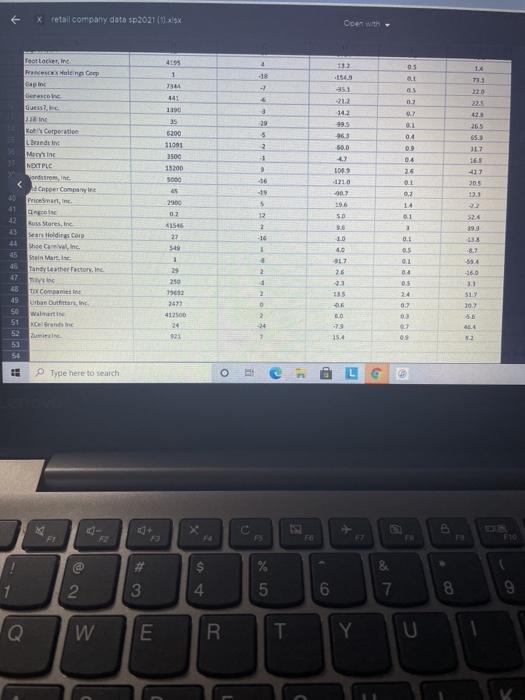
2. Organize the data for Profit Margt in a grouped frequency distribution using - 30 to-26 as the class limits of the first class. Make a relative frequency histogram. Describe the shape of the histogram. Predict, from the shape of the histogram, whether the mean is greater than the median or vice versa. Calculate the mean and the median Was your prediction correct? 3. Organize the data for Return on Equity in classes beginning with the class limits of 200 to-150.1 Draw an ogive for this data. Use your ogive to estimate the median. Then, find the actual median using the original data. Did the ogive provide a good estimate of the median? (Ogive is a graph of percentiles-it associates cumulative relative frequency with UPPER class boundary for each clas) X retail company data sp2021 (1).xlsx Open with 03 39 3 - 1 1 5100 15 16 4 1 13 ILE 15 25 12 23 30 NG Bis Wealth Helene 10 Bon consor 19 12 Dune 13 lors 10 15 Calen 16 Catecore 17 N'S FASI centace 1. ou Trend 20 Om det 21 22 Den 23 Decor 24 Destinatie 13 02 325 213 201 738 94 1305 -29 015 1 03 11 18 DA 3 16 231 09 14 + 3 1 0 1 C. Footlode 21 26 27 20 20 30 31 32 1 LES OR 441 10 : G Type her c Lenovo 13 0 # $ % 3 4 2 5 0) 7 8 W Q T 0 E R. Y J D G S H UL 1.4 713 220 22 0.7 3 29 reat Lacine Francesc Maling op Caine Leo Guess? ins Mos Corporation Lindley Mein NEXT PLC tromine Ad Carper Company in Pricamatic 41 Buss stores, in Sen oldies 43 Shoe Carval, Inc. SheinMart 16 Tandyther tatov.in 1190 35 6200 11091 3500 13200 5000 137 1543 351 -212 14.2 99.5 -963 60.0 4. 108.9 1210 2 -1 07 1 04 09 04 25 265 65.3 17 161 437 205 12.3 OL 0,2 2900 16 -19 $ 12 2 -16 LA 02 415 19 SD 06 10 1.0 917 1 . 399 1 0.1 2 76 23 ES 460 2.1 548 + 29 250 79612 2477 412500 24 991 2 07 TIX Com Urban Outfitters, Walmart Nanine 20.7 16 49 SO 51 52 53 56 an LO 3 0 2 -24 1 154 27 09 2 D Type here to search O G x + FE FO FIO Ne & 7 3 4 5 6 8 9 Q W E E R. T Y U 2. Organize the data for Profit Margt in a grouped frequency distribution using - 30 to-26 as the class limits of the first class. Make a relative frequency histogram. Describe the shape of the histogram. Predict, from the shape of the histogram, whether the mean is greater than the median or vice versa. Calculate the mean and the median Was your prediction correct? 3. Organize the data for Return on Equity in classes beginning with the class limits of 200 to-150.1 Draw an ogive for this data. Use your ogive to estimate the median. Then, find the actual median using the original data. Did the ogive provide a good estimate of the median? (Ogive is a graph of percentiles-it associates cumulative relative frequency with UPPER class boundary for each clas) X retail company data sp2021 (1).xlsx Open with 03 39 3 - 1 1 5100 15 16 4 1 13 ILE 15 25 12 23 30 NG Bis Wealth Helene 10 Bon consor 19 12 Dune 13 lors 10 15 Calen 16 Catecore 17 N'S FASI centace 1. ou Trend 20 Om det 21 22 Den 23 Decor 24 Destinatie 13 02 325 213 201 738 94 1305 -29 015 1 03 11 18 DA 3 16 231 09 14 + 3 1 0 1 C. Footlode 21 26 27 20 20 30 31 32 1 LES OR 441 10 : G Type her c Lenovo 13 0 # $ % 3 4 2 5 0) 7 8 W Q T 0 E R. Y J D G S H UL 1.4 713 220 22 0.7 3 29 reat Lacine Francesc Maling op Caine Leo Guess? ins Mos Corporation Lindley Mein NEXT PLC tromine Ad Carper Company in Pricamatic 41 Buss stores, in Sen oldies 43 Shoe Carval, Inc. SheinMart 16 Tandyther tatov.in 1190 35 6200 11091 3500 13200 5000 137 1543 351 -212 14.2 99.5 -963 60.0 4. 108.9 1210 2 -1 07 1 04 09 04 25 265 65.3 17 161 437 205 12.3 OL 0,2 2900 16 -19 $ 12 2 -16 LA 02 415 19 SD 06 10 1.0 917 1 . 399 1 0.1 2 76 23 ES 460 2.1 548 + 29 250 79612 2477 412500 24 991 2 07 TIX Com Urban Outfitters, Walmart Nanine 20.7 16 49 SO 51 52 53 56 an LO 3 0 2 -24 1 154 27 09 2 D Type here to search O G x + FE FO FIO Ne & 7 3 4 5 6 8 9 Q W E E R. T Y U