Answered step by step
Verified Expert Solution
Link Copied!

Question

1 Approved Answer

2. Part a: The following table shows multiple input levels (lbs. of Nitrogen), output price, total revenue, and total cost. Calculate marginal value product (MVP)
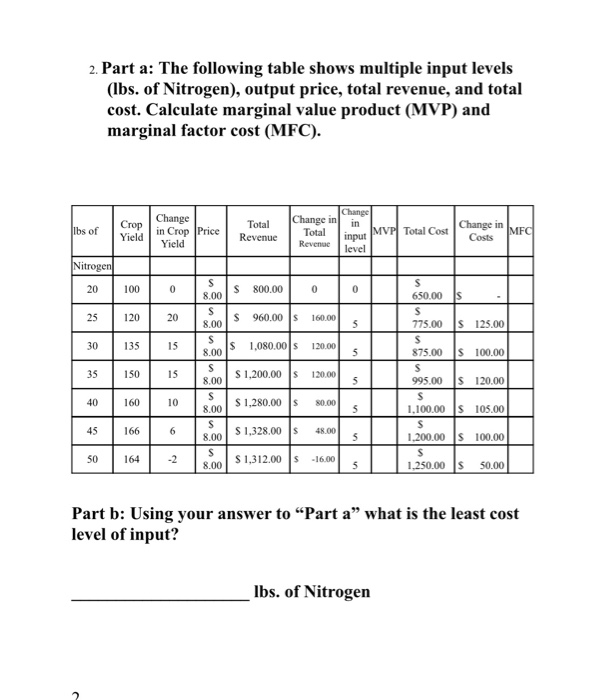
image text in transcribed
2. Part a: The following table shows multiple input levels (lbs. of Nitrogen), output price, total revenue, and total cost. Calculate marginal value product (MVP) and marginal factor cost (MFC). Crop Yield lbs of Change in Crop Price Yield Total Revenue Change in Change Change in in Total MVP Total Cost input Revenue level MFC Costs Nitrogen 20 100 0 $ 800.00 0 0 25 120 20 S 960.00 IS 160.00 5 30 135 IS $ 1,080.00 120.00 5 $ 650.00 Is $ 775.00 S 125.00 $ 875.00 S 100.00 $ 995.00 S 120.00 S 1,100.00 S 105.00 s 1,200.00 100.00 35 150 S 8.00 S 8.00 S 8.00 S 8.00 S 8.00 S 8.00 s 8.00 15 120.00 5 S 1,200.00 $ 1,280.00 40 160 10 80.00 5 45 166 6 48.00 S 1,328.00 $ 1,312.00 50 164 -2 -16.00 5 1.250.00 50.00 Part b: Using your answer to Part a what is the least cost level of input? lbs. of Nitrogen

Step by Step Solution

There are 3 Steps involved in it

Step: 1

blur-text-image

Get Instant Access to Expert-Tailored Solutions

See step-by-step solutions with expert insights and AI powered tools for academic success

Step: 2

blur-text-image_2

Step: 3

blur-text-image_3

Ace Your Homework with AI

Get the answers you need in no time with our AI-driven, step-by-step assistance

Get Started

Recommended Textbook for

African Charter For Internal Audit Of Cooperative Governance

Authors: Donfack MEKONTCHOU ROCHE

1st Edition

6205541777, 978-6205541777

More Books

Students also viewed these Accounting questions