

Answered step by step
Verified Expert Solution
Question
1 Approved Answer
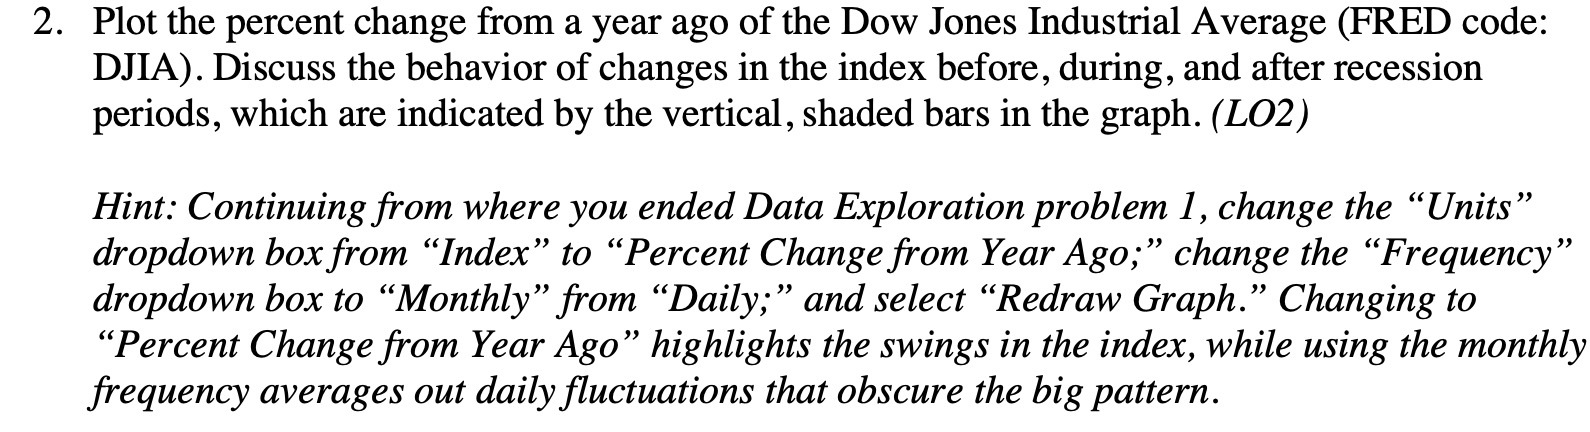
2. Plot the percent change from a year ago of the Dow Jones Industrial Average (FRED code: DJIA). Discuss the behavior of changes in the
Step by Step Solution
There are 3 Steps involved in it
Step: 1

Get Instant Access to Expert-Tailored Solutions
See step-by-step solutions with expert insights and AI powered tools for academic success
Step: 2

Step: 3
Ace Your Homework with AI
Get the answers you need in no time with our AI-driven, step-by-step assistance
Get Started
Introduction to Real Analysis
Authors: Robert G. Bartle, Donald R. Sherbert
4th edition
471433314, 978-1118135853, 1118135857, 978-1118135860, 1118135865, 978-0471433316