

Answered step by step
Verified Expert Solution
Question
1 Approved Answer
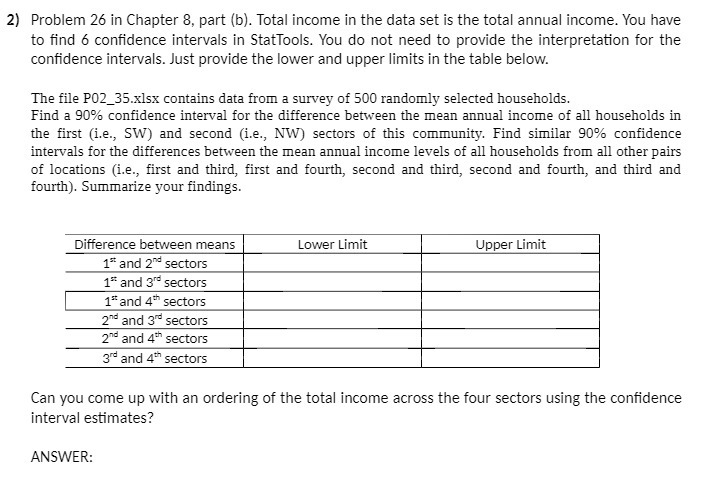
2) Problem 26 in Chapter 8, part (b). Total income in the data set is the total annual income. You have to find 6 confidence
Step by Step Solution
There are 3 Steps involved in it
Step: 1

Get Instant Access to Expert-Tailored Solutions
See step-by-step solutions with expert insights and AI powered tools for academic success
Step: 2

Step: 3
Ace Your Homework with AI
Get the answers you need in no time with our AI-driven, step-by-step assistance
Get Started
Introduction to Probability
Authors: Mark Daniel Ward, Ellen Gundlach
1st edition