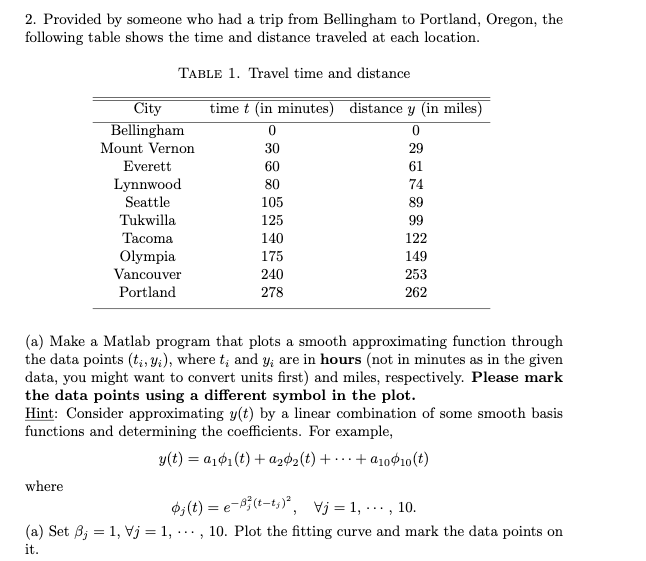
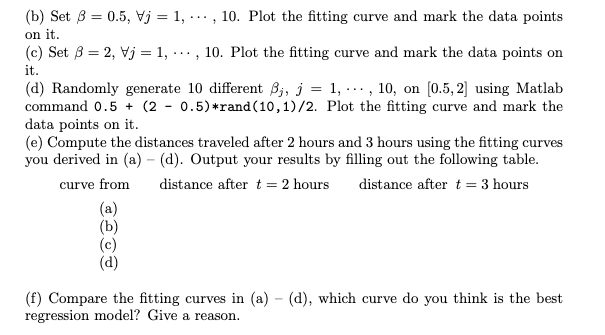
2. Provided by someone who had a trip from Bellingham to Portland, Oregon, the following table shows the time and distance traveled at each location. TABLE 1. Travel time and distance 29 City Bellingham Mount Vernon Everett Lynnwood Seattle Tukwilla Tacoma Olympia Vancouver Portland time t (in minutes) distance y (in miles) 0 0 30 60 61 80 74 105 89 125 99 140 122 175 149 240 253 278 262 (a) Make a Matlab program that plots a smooth approximating function through the data points (ti, y), where t; and y, are in hours (not in minutes as in the given data, you might want to convert units first) and miles, respectively. Please mark the data points using a different symbol in the plot. Hint: Consider approximating y(t) by a linear combination of some smooth basis functions and determining the coefficients. For example, y(t) = 210.(t) + a202(t) + +010010(t) where $;(t) = e-8;(t-t;)*, Vj = 1, ..., 10. (a) Set B; = 1, Vj = 1, ..., 10. Plot the fitting curve and mark the data points on it. (b) Set B = 0.5, Vj = 1, ... , 10. Plot the fitting curve and mark the data points on it. (c) Set 8 = 2, Vj = 1, ..., 10. Plot the fitting curve and mark the data points on it. (d) Randomly generate 10 different Bj, j = 1, ..., 10, on (0.5, 2) using Matlab command 0.5 + (2 - 0.5)*rand (10,1)/2. Plot the fitting curve and mark the data points on it. (e) Compute the distances traveled after 2 hours and 3 hours using the fitting curves you derived in (a) - (d). Output your results by filling out the following table. curve from distance after t = 2 hours distance after t = 3 hours (a) (b) (f) Compare the fitting curves in (a) - (d), which curve do you think is the best regression model? Give a reason. 2. Provided by someone who had a trip from Bellingham to Portland, Oregon, the following table shows the time and distance traveled at each location. TABLE 1. Travel time and distance 29 City Bellingham Mount Vernon Everett Lynnwood Seattle Tukwilla Tacoma Olympia Vancouver Portland time t (in minutes) distance y (in miles) 0 0 30 60 61 80 74 105 89 125 99 140 122 175 149 240 253 278 262 (a) Make a Matlab program that plots a smooth approximating function through the data points (ti, y), where t; and y, are in hours (not in minutes as in the given data, you might want to convert units first) and miles, respectively. Please mark the data points using a different symbol in the plot. Hint: Consider approximating y(t) by a linear combination of some smooth basis functions and determining the coefficients. For example, y(t) = 210.(t) + a202(t) + +010010(t) where $;(t) = e-8;(t-t;)*, Vj = 1, ..., 10. (a) Set B; = 1, Vj = 1, ..., 10. Plot the fitting curve and mark the data points on it. (b) Set B = 0.5, Vj = 1, ... , 10. Plot the fitting curve and mark the data points on it. (c) Set 8 = 2, Vj = 1, ..., 10. Plot the fitting curve and mark the data points on it. (d) Randomly generate 10 different Bj, j = 1, ..., 10, on (0.5, 2) using Matlab command 0.5 + (2 - 0.5)*rand (10,1)/2. Plot the fitting curve and mark the data points on it. (e) Compute the distances traveled after 2 hours and 3 hours using the fitting curves you derived in (a) - (d). Output your results by filling out the following table. curve from distance after t = 2 hours distance after t = 3 hours (a) (b) (f) Compare the fitting curves in (a) - (d), which curve do you think is the best regression model? Give a reason