

Answered step by step
Verified Expert Solution
Question
1 Approved Answer
(2 pts) Consider the network shown in Figure 1 , where the [bi] values next to the nodes indicate a source node demand (if +
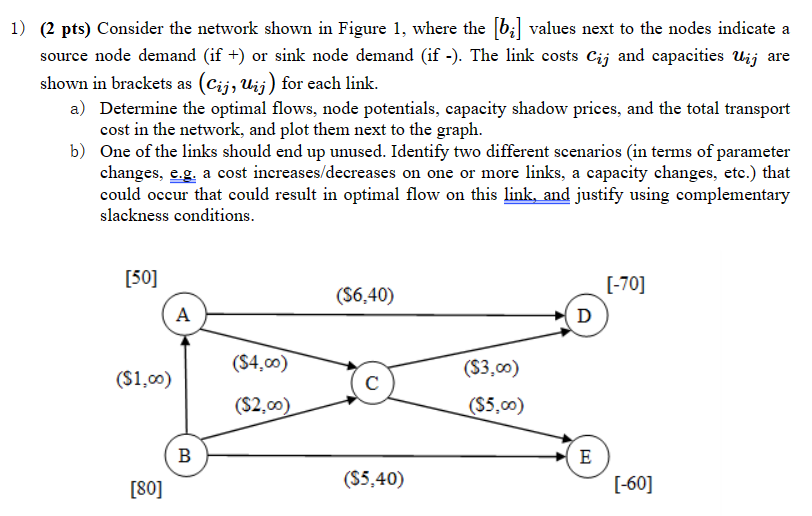 (2 pts) Consider the network shown in Figure 1 , where the [bi] values next to the nodes indicate a source node demand (if + ) or sink node demand (if -). The link costs cij and capacities uij are shown in brackets as (cij,uij) for each link. a) Determine the optimal flows, node potentials, capacity shadow prices, and the total transport cost in the network, and plot them next to the graph. b) One of the links should end up unused. Identify two different scenarios (in terms of parameter changes, e.g. a cost increases/decreases on one or more links, a capacity changes, etc.) that could occur that could result in optimal flow on this link, and justify using complementary slackness conditions
Step by Step Solution
There are 3 Steps involved in it
Step: 1

Get Instant Access to Expert-Tailored Solutions
See step-by-step solutions with expert insights and AI powered tools for academic success
Step: 2

Step: 3
Ace Your Homework with AI
Get the answers you need in no time with our AI-driven, step-by-step assistance
Get Started
Management Fundamentals
Authors: Robert N. Lussier
9th Edition
154438419X, 978-1544384191