Answered step by step
Verified Expert Solution
Question
1 Approved Answer
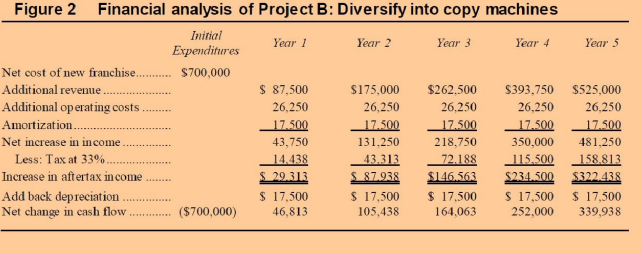
2. Refer to Figures 1 through 3. Add up the total increase in after-tax income for each project. Given what you know about Kay Marsh,
2. Refer to Figures 1 through 3. Add up the total increase in after-tax income for each project. Given what you know about Kay Marsh, to which project do you think she will be attracted?
2. Compute the payback period, net present value (NPV), Profitability Index of all four alternatives based on cash flow. Use 10 % the required rate of return (discount rate) in your calculations. For the payback method, merely indicate the year in which the cash flow equals or exceeds the initial investment. You do not have to compute midyear points.

Step by Step Solution
There are 3 Steps involved in it
Step: 1

Get Instant Access to Expert-Tailored Solutions
See step-by-step solutions with expert insights and AI powered tools for academic success
Step: 2

Step: 3

Ace Your Homework with AI
Get the answers you need in no time with our AI-driven, step-by-step assistance
Get Started


