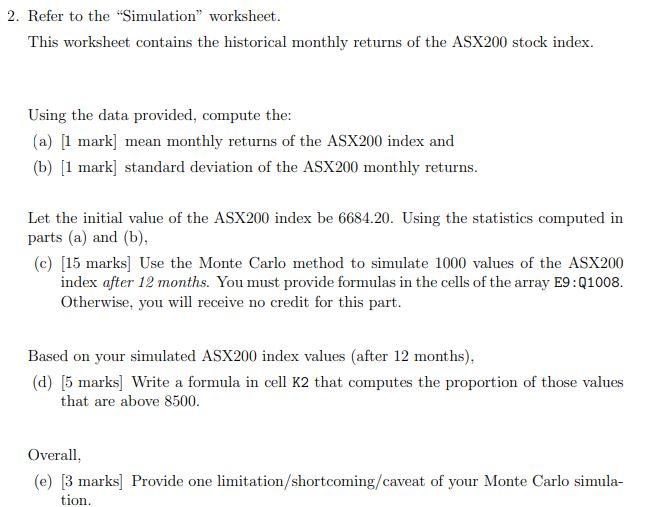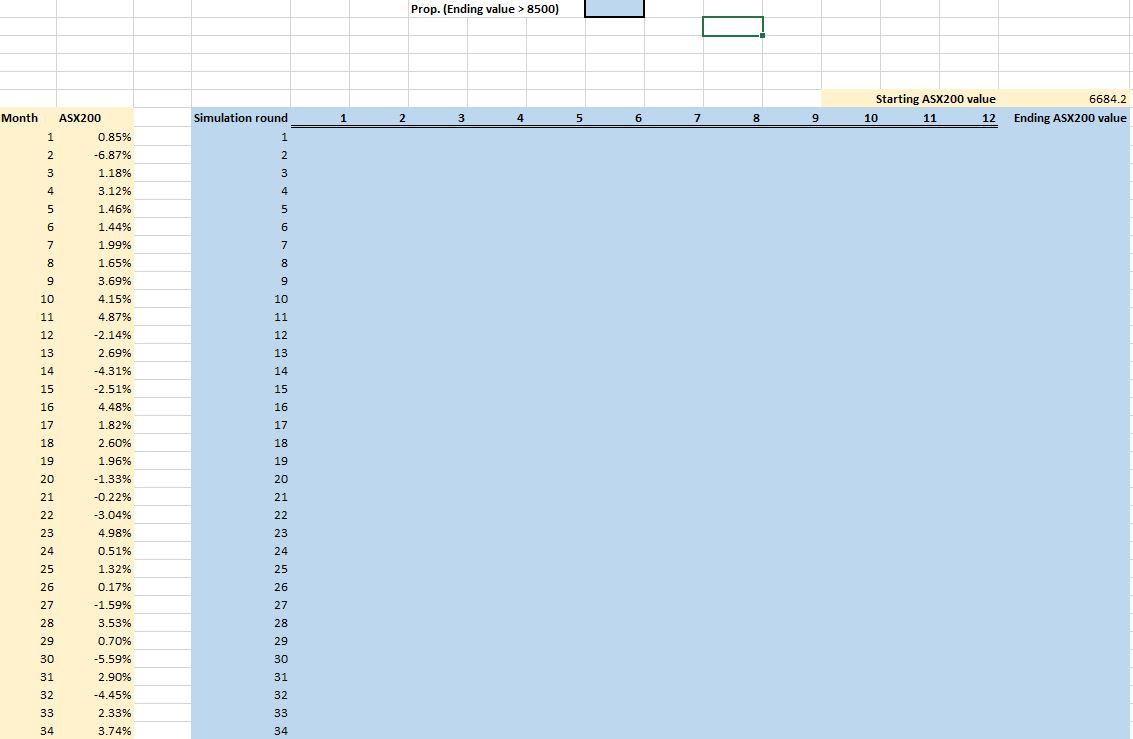

2. Refer to the "Simulation worksheet. This worksheet contains the historical monthly returns of the ASX200 stock index. Using the data provided, compute the: (a) [1 mark] mean monthly returns of the ASX200 index and (b) [1 mark] standard deviation of the ASX200 monthly returns. Let the initial value of the ASX200 index be 6684.20. Using the statistics computed in parts (a) and (b), (c) [15 marks] Use the Monte Carlo method to simulate 1000 values of the ASX200 index after 12 months. You must provide formulas in the cells of the array E9: Q1008. Otherwise, you will receive no credit for this part. Based on your simulated ASX200 index values (after 12 months), (d) (5 marks] Write a formula in cell K2 that computes the proportion of those values that are above 8500. Overall (e) [3 marks] Provide one limitation/shortcoming/caveat of your Monte Carlo simula- tion. Prop. (Ending value > 8500) Starting ASX200 value 6684.2 10 11 12 Ending ASX200 value Month ASX200 Simulation round 1 2 3 4 5 6 7 8 9 1 0.85% 1 2 -6.87% 2 3 1.18% 3 4 3.12% 4 5 1.46% 5 6 1.449 6 7 1.99% 7 8 1.65% 8 9 3.69% 9 10 4.15% 10 11 4.87% 11 12 -2.14% 12 13 2.69% 13 14 -4.31% 14 15 -2.51% 15 16 4.48% 16 17 1.82% 17 18 2.60% 18 19 1.96% 19 20 -1.33% 20 21 -0.22% 21 22 -3.04% 22 23 4.98% 23 24 0.51% 24 25 1.32% 25 26 0.17% 26 27 -1.59% 27 28 3.53% 28 29 0.70% 29 30 -5.59% 30 31 2.90% 31 32 -4.45% 32 33 2.33% 33 34 3.74% 34 2. Refer to the "Simulation worksheet. This worksheet contains the historical monthly returns of the ASX200 stock index. Using the data provided, compute the: (a) [1 mark] mean monthly returns of the ASX200 index and (b) [1 mark] standard deviation of the ASX200 monthly returns. Let the initial value of the ASX200 index be 6684.20. Using the statistics computed in parts (a) and (b), (c) [15 marks] Use the Monte Carlo method to simulate 1000 values of the ASX200 index after 12 months. You must provide formulas in the cells of the array E9: Q1008. Otherwise, you will receive no credit for this part. Based on your simulated ASX200 index values (after 12 months), (d) (5 marks] Write a formula in cell K2 that computes the proportion of those values that are above 8500. Overall (e) [3 marks] Provide one limitation/shortcoming/caveat of your Monte Carlo simula- tion. Prop. (Ending value > 8500) Starting ASX200 value 6684.2 10 11 12 Ending ASX200 value Month ASX200 Simulation round 1 2 3 4 5 6 7 8 9 1 0.85% 1 2 -6.87% 2 3 1.18% 3 4 3.12% 4 5 1.46% 5 6 1.449 6 7 1.99% 7 8 1.65% 8 9 3.69% 9 10 4.15% 10 11 4.87% 11 12 -2.14% 12 13 2.69% 13 14 -4.31% 14 15 -2.51% 15 16 4.48% 16 17 1.82% 17 18 2.60% 18 19 1.96% 19 20 -1.33% 20 21 -0.22% 21 22 -3.04% 22 23 4.98% 23 24 0.51% 24 25 1.32% 25 26 0.17% 26 27 -1.59% 27 28 3.53% 28 29 0.70% 29 30 -5.59% 30 31 2.90% 31 32 -4.45% 32 33 2.33% 33 34 3.74% 34


