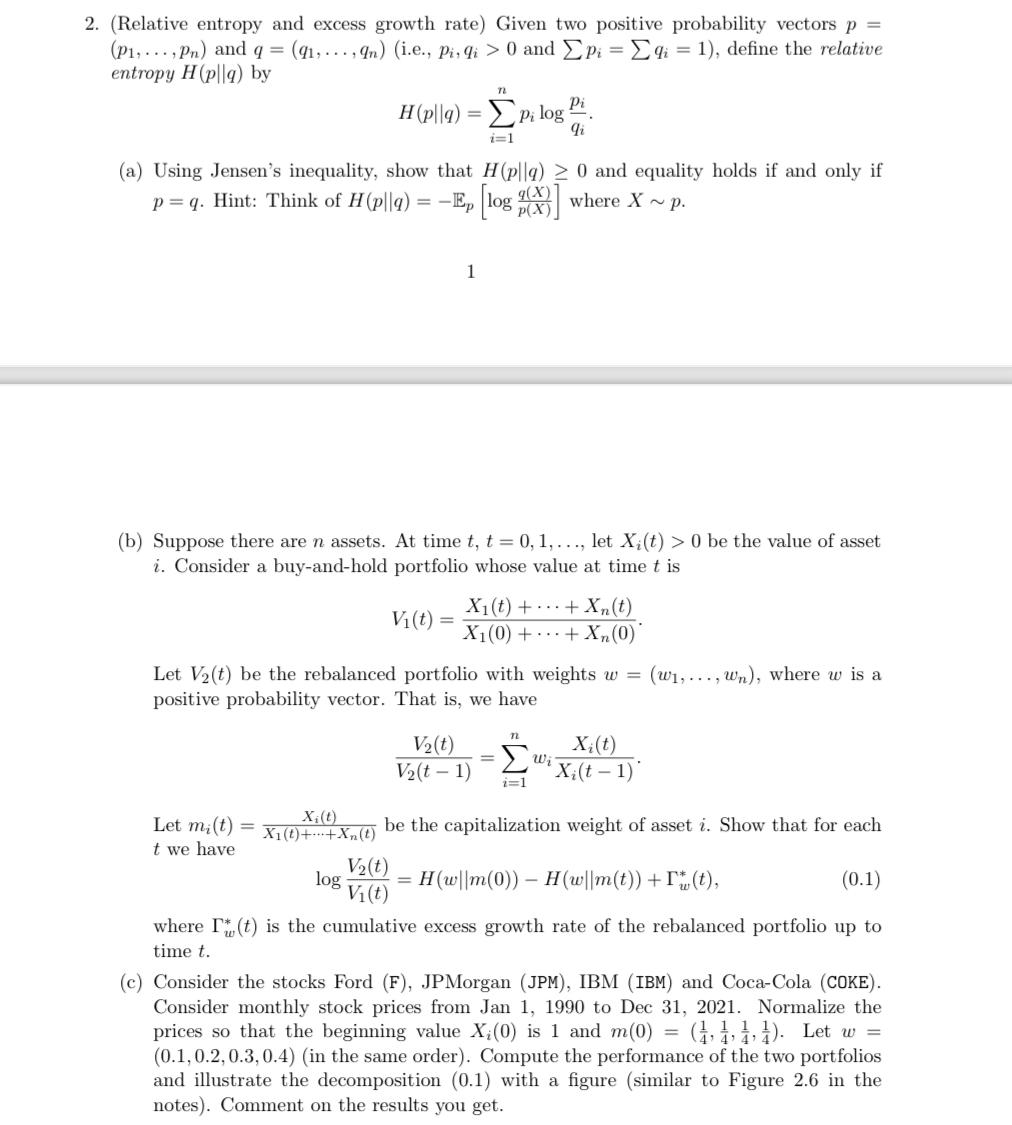
2. (Relative entropy and excess growth rate) Given two positive probability vectors p = (P1, ...,Pn) and q= (91, ..., 9n) (i.e., Pi, qi > 0 and pi= d = 1), define the relative entropy H(plla) by H(pl|q) = p;log PL 9 n i=1 (a) Using Jensen's inequality, show that H(plla) > 0 and equality holds if and only if p=q. Hint: Think of H (p||) = -E, (log (X)) where X ~p. 1 (b) Suppose there are n assets. At time t, t = 0,1,..., let X;(t) > 0 be the value of asset i. Consider a buy-and-hold portfolio whose value at time t is Xi(t) + ... + xn(t) Vi(t) = X1(0) +...+X (0) Let V2(t) be the rebalanced portfolio with weights w = (w1,..., wn), where w is a positive probability vector. That is, we have V2(t) V2(t-1) w Xi(t) X (t-1) i=1 Let mi(t) X:(0) X1 (t)+...+Xn(0) be the capitalization weight of asset i. Show that for each t we have V2(t) log H(w||m(0)) - H(w||m(t))+1,(t), (0.1) Vit) where r(t) is the cumulative excess growth rate of the rebalanced portfolio up to time t. (c) Consider the stocks Ford (F), JPMorgan (JPM), IBM (IBM) and Coca-Cola (COKE). Consider monthly stock prices from Jan 1, 1990 to Dec 31, 2021. Normalize the prices so that the beginning value X:(0) is 1 and m(0) = (1, 1, 1, 1). Let w = (0.1,0.2, 0.3, 0.4) (in the same order). Compute the performance of the two portfolios and illustrate the decomposition (0.1) with a figure (similar to Figure 2.6 in the notes). Comment on the results you get. 2. (Relative entropy and excess growth rate) Given two positive probability vectors p = (P1, ...,Pn) and q= (91, ..., 9n) (i.e., Pi, qi > 0 and pi= d = 1), define the relative entropy H(plla) by H(pl|q) = p;log PL 9 n i=1 (a) Using Jensen's inequality, show that H(plla) > 0 and equality holds if and only if p=q. Hint: Think of H (p||) = -E, (log (X)) where X ~p. 1 (b) Suppose there are n assets. At time t, t = 0,1,..., let X;(t) > 0 be the value of asset i. Consider a buy-and-hold portfolio whose value at time t is Xi(t) + ... + xn(t) Vi(t) = X1(0) +...+X (0) Let V2(t) be the rebalanced portfolio with weights w = (w1,..., wn), where w is a positive probability vector. That is, we have V2(t) V2(t-1) w Xi(t) X (t-1) i=1 Let mi(t) X:(0) X1 (t)+...+Xn(0) be the capitalization weight of asset i. Show that for each t we have V2(t) log H(w||m(0)) - H(w||m(t))+1,(t), (0.1) Vit) where r(t) is the cumulative excess growth rate of the rebalanced portfolio up to time t. (c) Consider the stocks Ford (F), JPMorgan (JPM), IBM (IBM) and Coca-Cola (COKE). Consider monthly stock prices from Jan 1, 1990 to Dec 31, 2021. Normalize the prices so that the beginning value X:(0) is 1 and m(0) = (1, 1, 1, 1). Let w = (0.1,0.2, 0.3, 0.4) (in the same order). Compute the performance of the two portfolios and illustrate the decomposition (0.1) with a figure (similar to Figure 2.6 in the notes). Comment on the results you get


