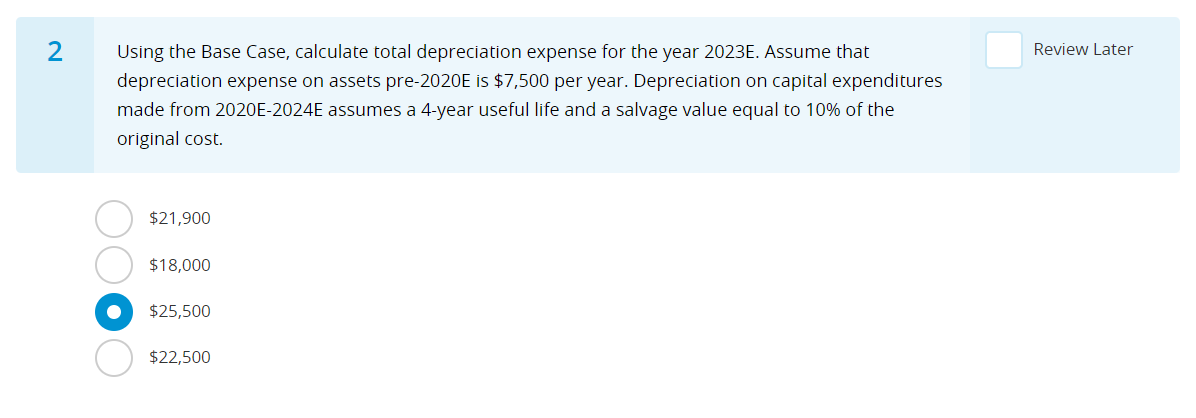
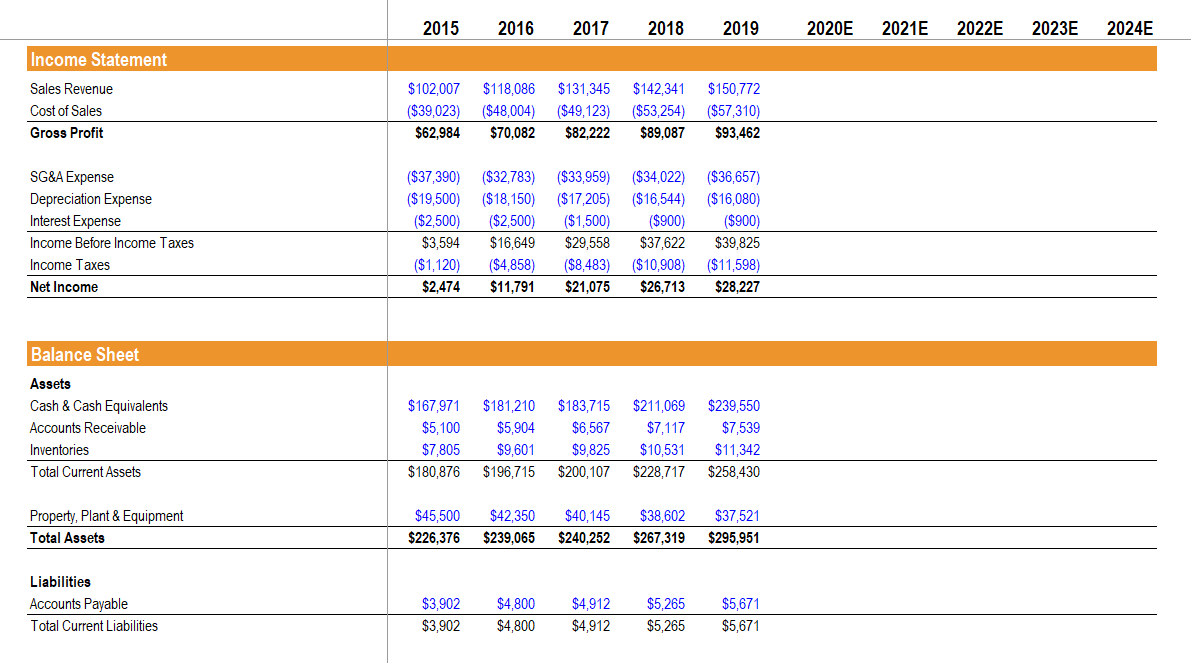
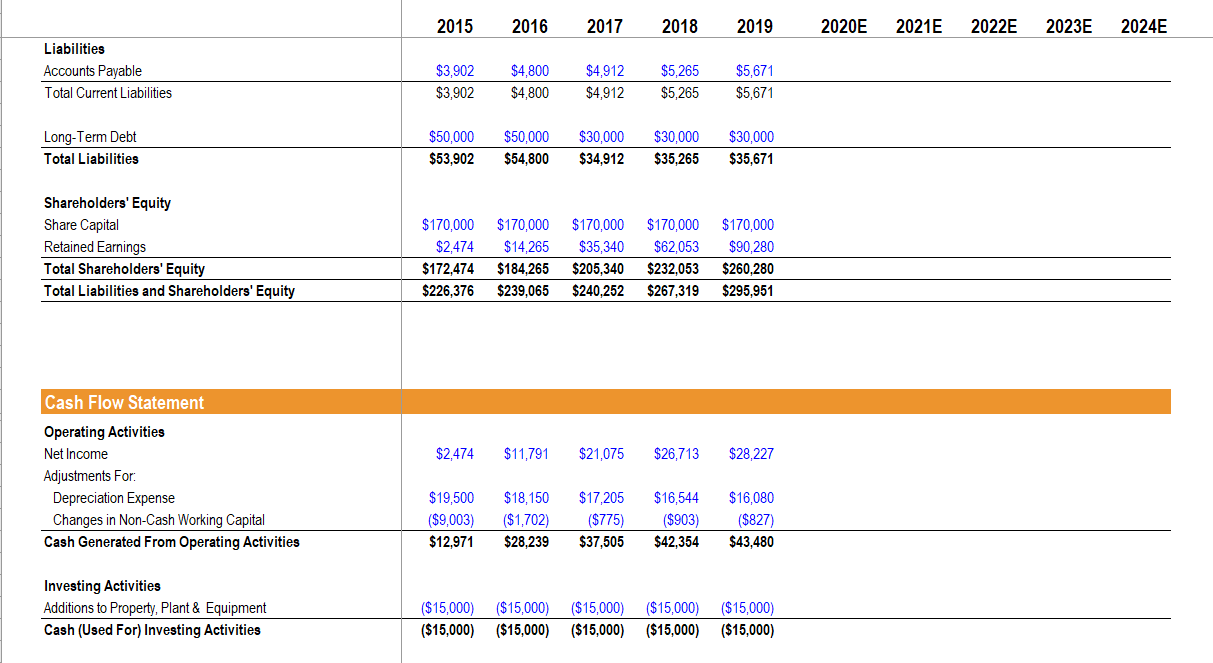
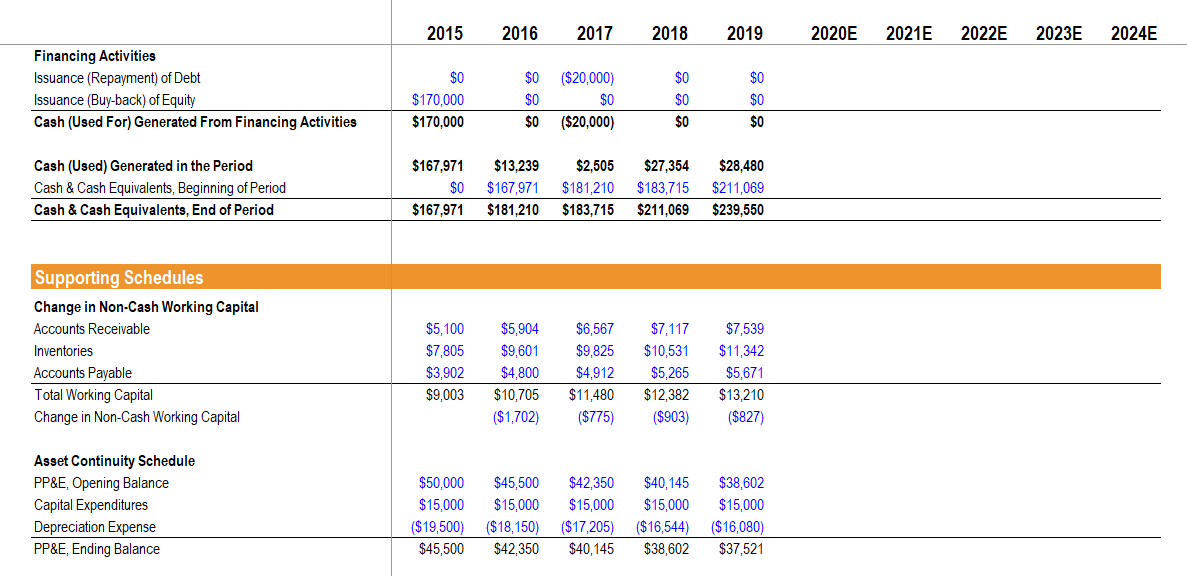
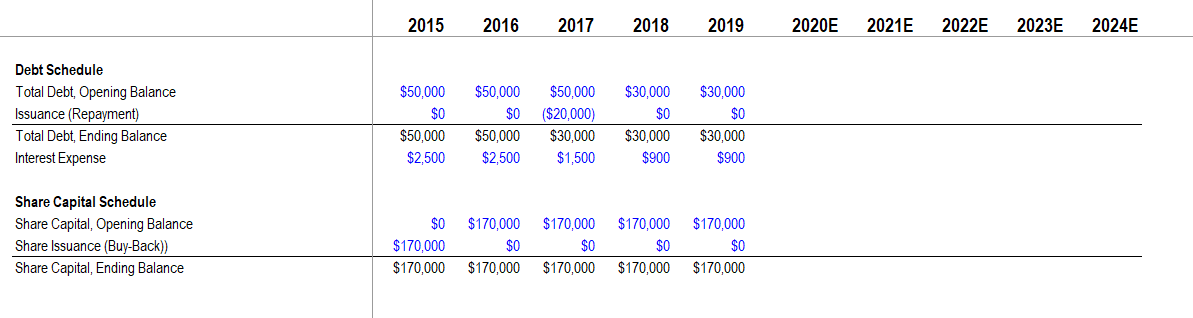
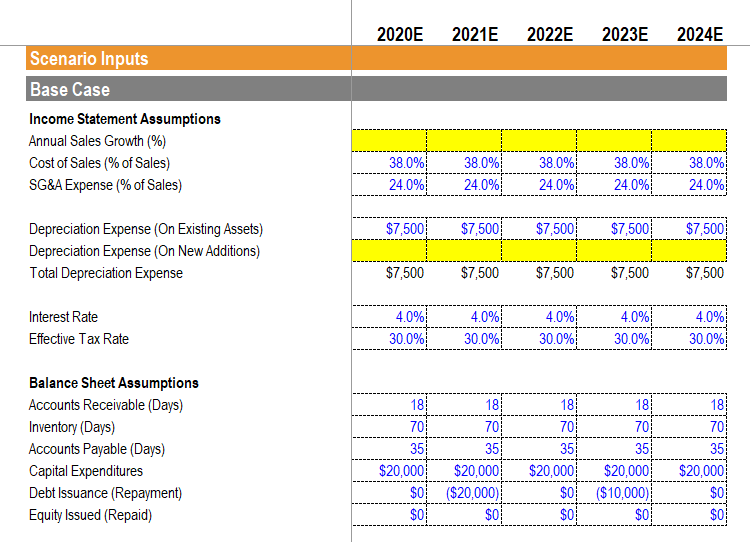
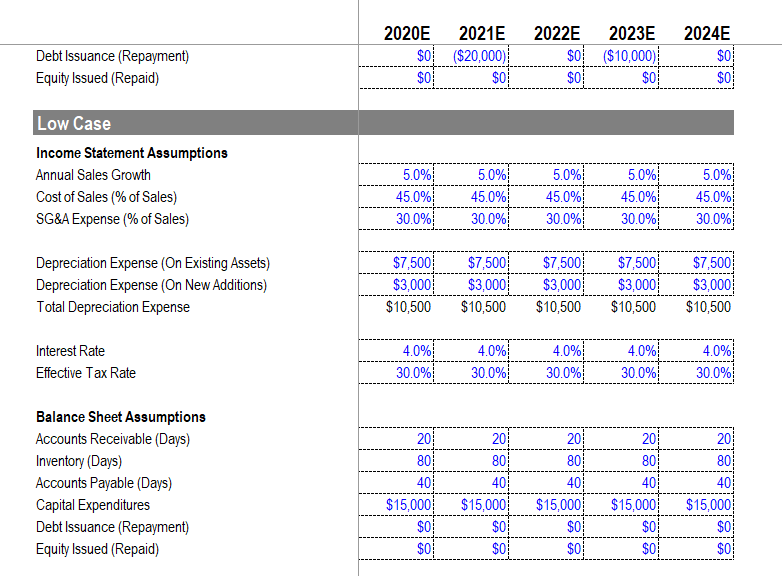
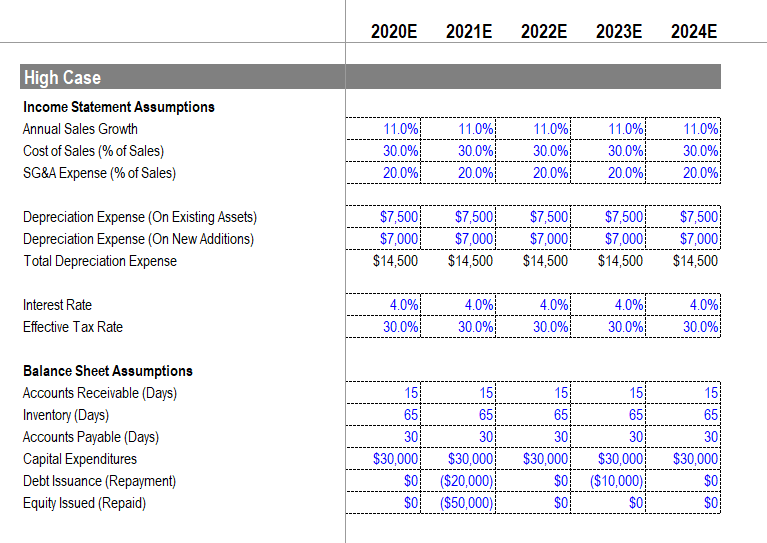
2 Review Later Using the Base Case, calculate total depreciation expense for the year 2023E. Assume that depreciation expense on assets pre-2020E is $7,500 per year. Depreciation on capital expenditures made from 2020E-2024E assumes a 4-year useful life and a salvage value equal to 10% of the original cost. $21,900 $18,000 $25,500 $22,500 2015 2016 2017 2018 2019 2020E 2021E 2022E 2023E 2024E Income Statement Sales Revenue Cost of Sales Gross Profit $102,007 $118,086 $131,345 $142,341 $150,772 ($39,023) ($48,004) ($49,123) ($53,254) ($57,310) $62,984 $70,082 $82,222 $89,087 $93,462 SG&A Expense Depreciation Expense Interest Expense Income Before Income Taxes Income Taxes Net Income ($37,390) ($32,783) ($33,959) ($34,022) ($36,657) ($19,500) ($18,150) ($17,205) ($16,544) ($16,080) ($2,500) ($2,500) ($1,500) ($900) ($900) $3,594 $16,649 $29.558 $37,622 $39,825 ($1,120) ($4,858) ($8,483) ($10,908) ($11,598) $2,474 $11,791 $21,075 $26,713 $28.227 Balance Sheet Assets Cash & Cash Equivalents Accounts Receivable Inventories Total Current Assets $167,971 $5,100 $7,805 $180,876 $181,210 $5,904 $9,601 $196,715 $183,715 $6,567 $9,825 $200,107 $211,069 $7,117 $10,531 $228,717 $239,550 $7,539 $11,342 $258,430 Property, Plant & Equipment Total Assets $45,500 $226,376 $42,350 $239,065 $40,145 $240,252 $38,602 $267,319 $37,521 $295,951 Liabilities Accounts Payable Total Current Liabilities $3,902 $3,902 $4,800 $4,800 $4.912 $4,912 $5,265 $5,265 $5,671 $5,671 2015 2016 2017 2018 2019 2020E 2021E 2022E 2023E 2024E Liabilities Accounts Payable Total Current Liabilities $3,902 $3,902 $4,800 $4,800 $4,912 $4,912 $5,265 $5,265 $5,671 $5,671 $50,000 Long-Term Debt Total Liabilities $50,000 $54.800 $30,000 $34.912 $30,000 $35,265 $30,000 $35,671 $53,902 Shareholders' Equity Share Capital Retained Earnings Total Shareholders' Equity Total Liabilities and Shareholders' Equity $170,000 $2,474 $172,474 $226,376 $170,000 $14.265 $184,265 $239,065 $170,000 $35.340 $205,340 $240.252 $170,000 $62,053 $232,053 $267,319 $170,000 $90,280 $260,280 $295,951 $2,474 $11,791 $21,075 $26,713 $28,227 Cash Flow Statement Operating Activities Net Income Adjustments For Depreciation Expense Changes in Non-Cash Working Capital Cash Generated From Operating Activities $19,500 ($9,003) $12,971 $18.150 ($1,702) $28,239 $17.205 ($775) $37,505 $16,544 ($903) $42,354 $16,080 ($827) $43,480 Investing Activities Additions to Property, Plant & Equipment Cash (Used For) Investing Activities ($15,000) ($15,000) ($15,000) ($15,000) ($15,000) ($15,000) ($15,000) ($15,000) ($15,000) ($15,000) 2015 2016 2017 2018 2019 2020E 2021E 2022E 2023E 2024E $0 $0 Financing Activities Issuance (Repayment) of Debt Issuance (Buy-back) of Equity Cash (Used For) Generated From Financing Activities $0 $170,000 $170,000 ($20,000) $0 ($20,000) $0 $0 $0 $0 $0 $0 $0 Cash (Used) Generated in the Period Cash & Cash Equivalents, Beginning of Period Cash & Cash Equivalents, End of Period $167,971 $0 $167,971 $13,239 $167,971 $181,210 $2,505 $181,210 $183,715 $27,354 $183,715 $211.069 $28,480 $211,069 $239,550 Supporting Schedules Change in Non-Cash Working Capital Accounts Receivable Inventories Accounts Payable Total Working Capital Change in Non-Cash Working Capital $5,100 $7,805 $3,902 $9,003 $5,904 $9,601 $4,800 $10,705 ($1,702) $6,567 $9,825 $4,912 $11,480 ($775) $7,117 $10,531 $5,265 $12,382 ($903) $7,539 $11,342 $5,671 $13,210 ($827) Asset Continuity Schedule PP&E, Opening Balance Capital Expenditures Depreciation Expense PP&E, Ending Balance $50,000 $15,000 ($19,500) $45,500 $45,500 $15,000 ($18,150) $42,350 $42,350 $15,000 ($17,205) $40,145 $40,145 $15,000 ($16,544) $38,602 $38,602 $15,000 ($16,080) $37,521 2015 2016 2017 2018 2019 2020E 2021E 2022E 2023E 2024E Debt Schedule Total Debt, Opening Balance Issuance (Repayment) Total Debt, Ending Balance Interest Expense $50,000 $0 $50,000 $2,500 $50,000 $50,000 $0 $20,000) $50,000 $30,000 $2,500 $1,500 $30,000 $0 $30,000 $900 $30,000 $0 $30,000 $900 Share Capital Schedule Share Capital, Opening Balance Share Issuance (Buy-Back)) Share Capital, Ending Balance $0 $170,000 $170,000 $170,000 $0 $170,000 $170,000 $0 $170,000 $170,000 $170,000 $0 $0 $170,000 $170,000 2020E 2021E 2022E 2023E 2024E Scenario Inputs Base Case Income Statement Assumptions Annual Sales Growth (%) Cost of Sales (% of Sales) SG&A Expense (% of Sales) 38.0% 24.0% 38.0% 24.0% 38.0% 24.0% 38.0% 24.0% 38.0% 24.0% $7,500 $7,500 $7,500 $7,500 $7,500 Depreciation Expense (On Existing Assets) Depreciation Expense (On New Additions) Total Depreciation Expense $7,500 $7,500 $7,500 $7,500 $7,500 Interest Rate Effective Tax Rate 4.0% 30.0% 4.0% 30.0% 4.0% 30.0% 4.0% 30.0% 4.0% 30.0% Balance Sheet Assumptions Accounts Receivable (Days) Inventory (Days) Accounts Payable (Days) Capital Expenditures Debt Issuance (Repayment) Equity Issued (Repaid) 18 18 70 70 35 35 $20,000 $20,000 $0 $20,000) $0 $0 18! 70 35 $20,000 $0 $0 18 70 35 $20,000 ($10,000) $0 18 70 35 $20,000 $0 $0 Debt Issuance (Repayment) Equity Issued (Repaid) 2020E 2021E $0 ($20,000) $0 $0 2022E 2023E $0 ($10,000) $0 $0 2024E $0 $0 Low Case Income Statement Assumptions Annual Sales Growth Cost of Sales (% of Sales) SG&A Expense (% of Sales) 5.0% 45.0% 30.0% 5.0% 45.0% 30.0% 5.0% 45.0% 30.0% 5.0% 45.0% 30.0% 5.0% 45.0% 30.0% Depreciation Expense (On Existing Assets) Depreciation Expense (On New Additions) Total Depreciation Expense $7,500 $3,000 $10,500 $7,500 $3,000 $10,500 $7,500 $3,000 $10,500 $7,500 $3,000 $10,500 $7,500 $3,000 $10,500 Interest Rate Effective Tax Rate 4.0% 30.0% 4.0% 30.0% 4.0% 30.0% 4.0% 30.0% 4.0% 30.0% Balance Sheet Assumptions Accounts Receivable (Days) Inventory (Days) Accounts Payable (Days) Capital Expenditures Debt Issuance (Repayment) Equity Issued (Repaid) 20 80 40 $15,000 $0 $0 20 80 40 $15,000 $0 $0 20 80 40 $15,000 $0 $0 20 80 40 $15,000 $0 $0 20 80 40 $15,000 $0 $0 2020E 2021E 2022E 2023E 2024E High Case Income Statement Assumptions Annual Sales Growth Cost of Sales (% of Sales) SG&A Expense (% of Sales) 11.0% 30.0% 20.0% 11.0% 30.0% 20.0% 11.0% 30.0% 20.0% 11.0% 30.0% 20.0% 11.0% 30.0% 20.0% Depreciation Expense (On Existing Assets) Depreciation Expense (On New Additions) Total Depreciation Expense $7,500 $7,000 $14,500 $7,500 $7,000 $14,500 $7,500 $7,000 $14,500 $7,500 $7,000 $14,500 $7,500 $7,000 $14,500 Interest Rate Effective Tax Rate 4.0% 30.0% 4.0% 30.0% 4.0% 30.0% 4.0% 30.0% 4.0% 30.0% 651 Balance Sheet Assumptions Accounts Receivable (Days) Inventory (Days) Accounts Payable (Days) Capital Expenditures Debt Issuance (Repayment) Equity Issued (Repaid) 15 15 65 65 30 30 $30,000 $30,000 $0 ($20,000) $0 ($50,000) 15 15 65 30 30 $30,000 $30,000 $0 ($10,000) $0 $0 15 65 30 $30,000 $0 $0


