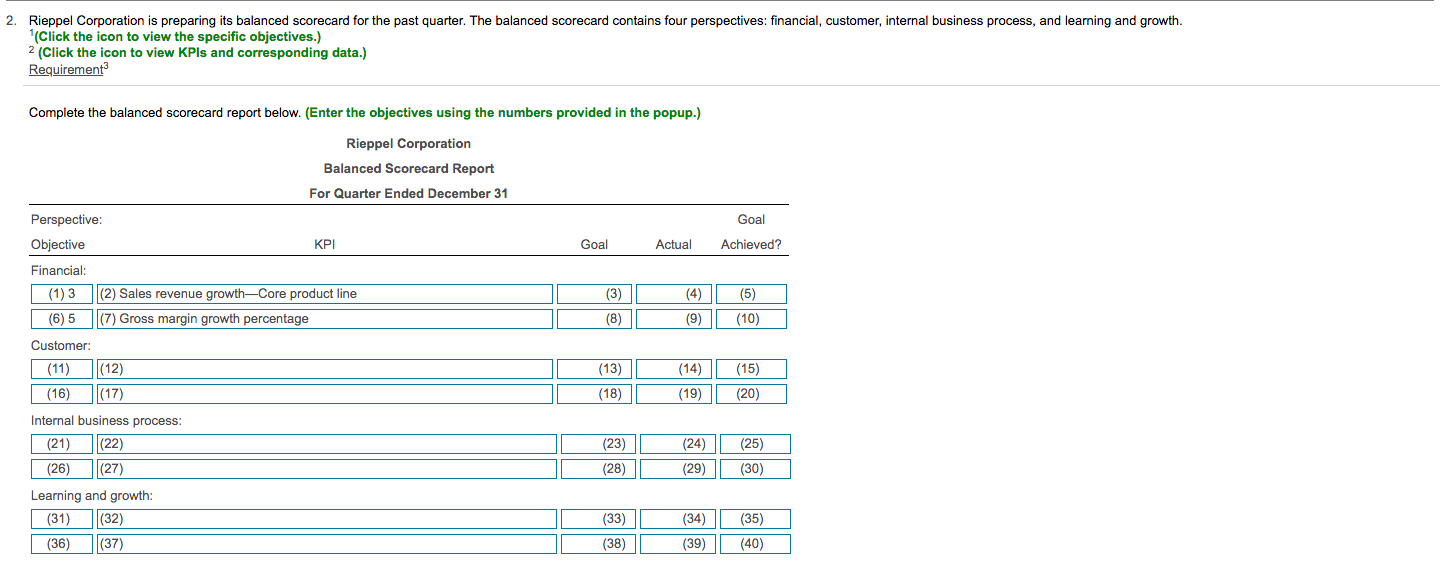
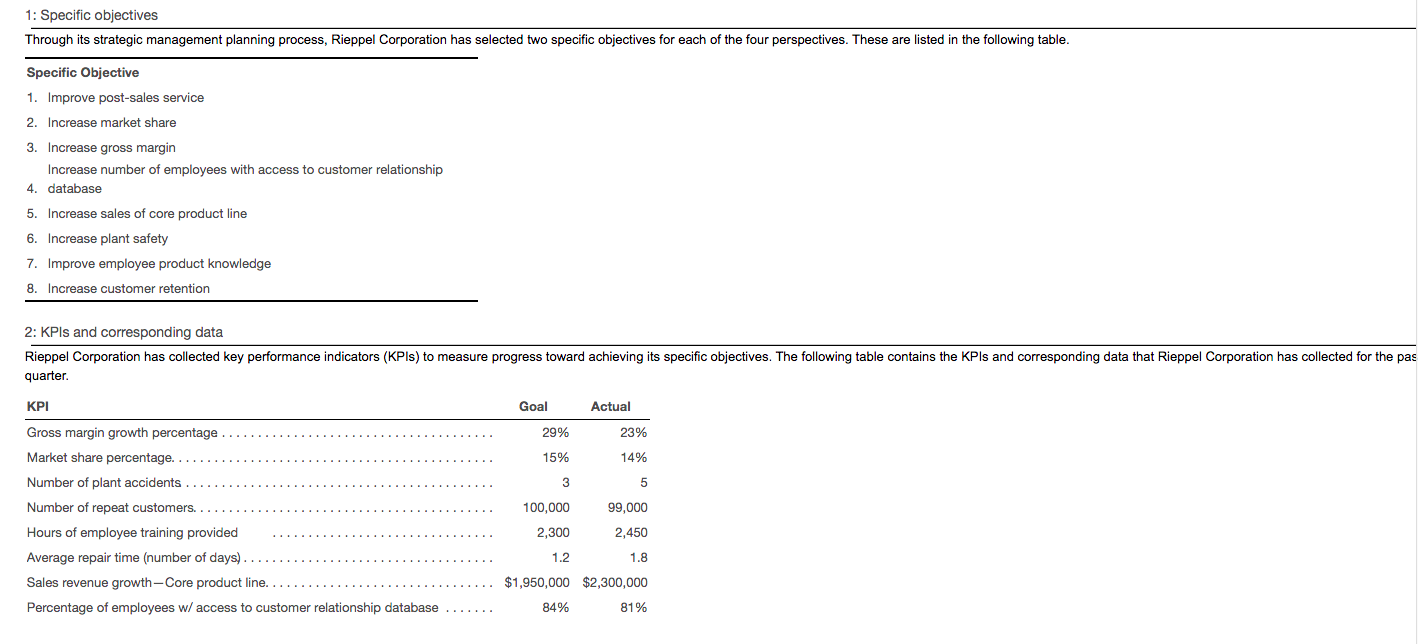
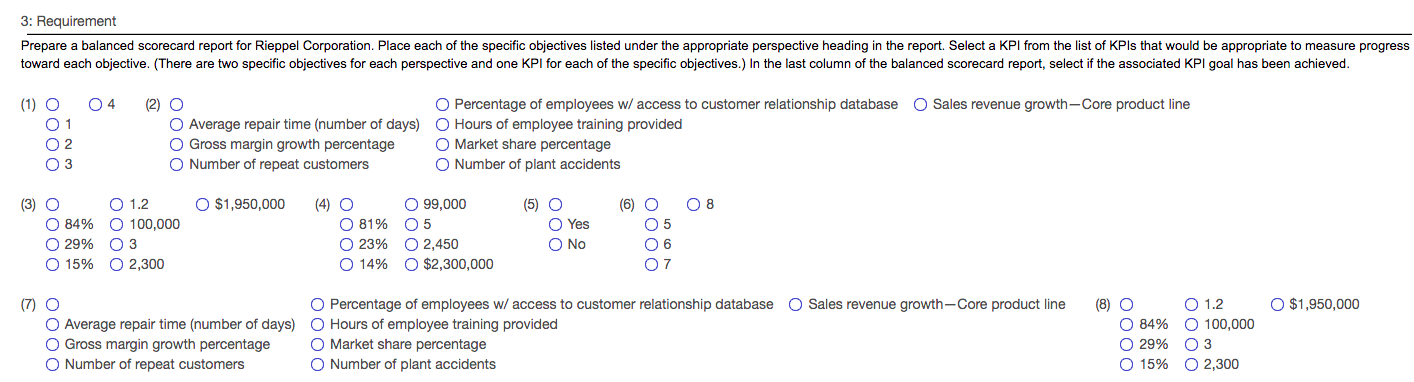
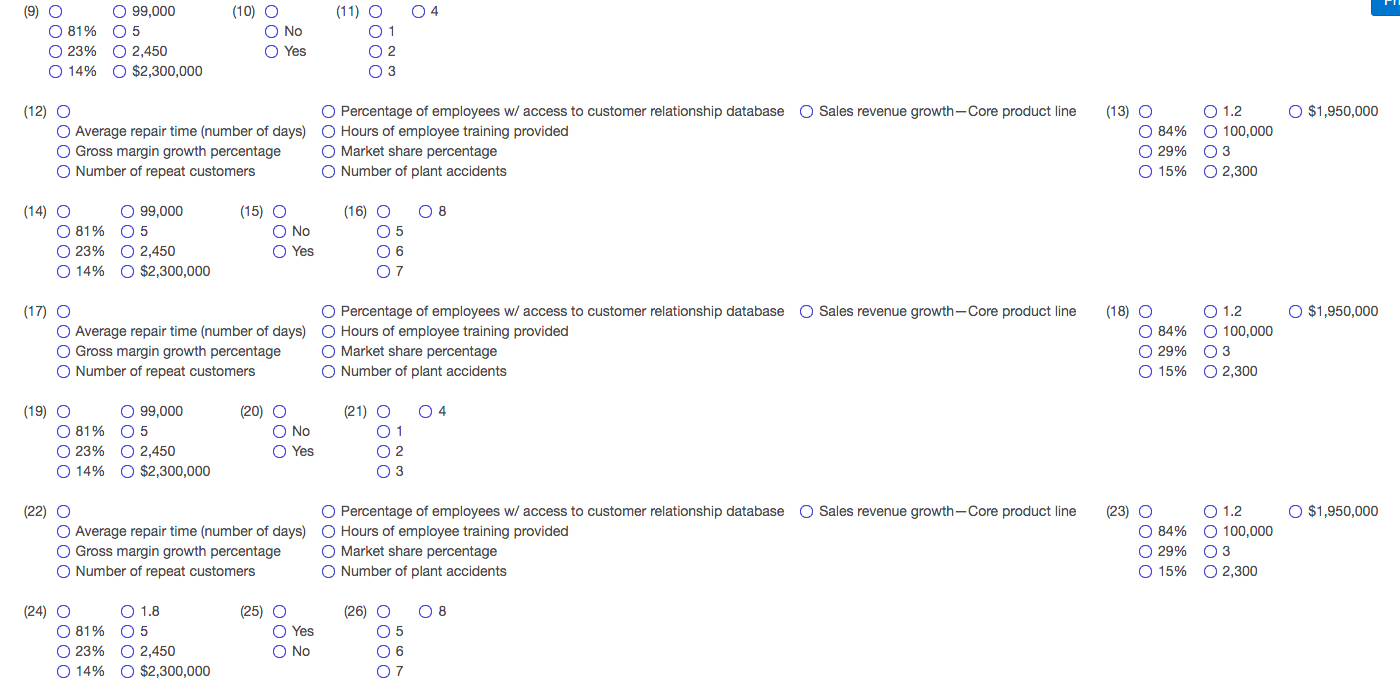
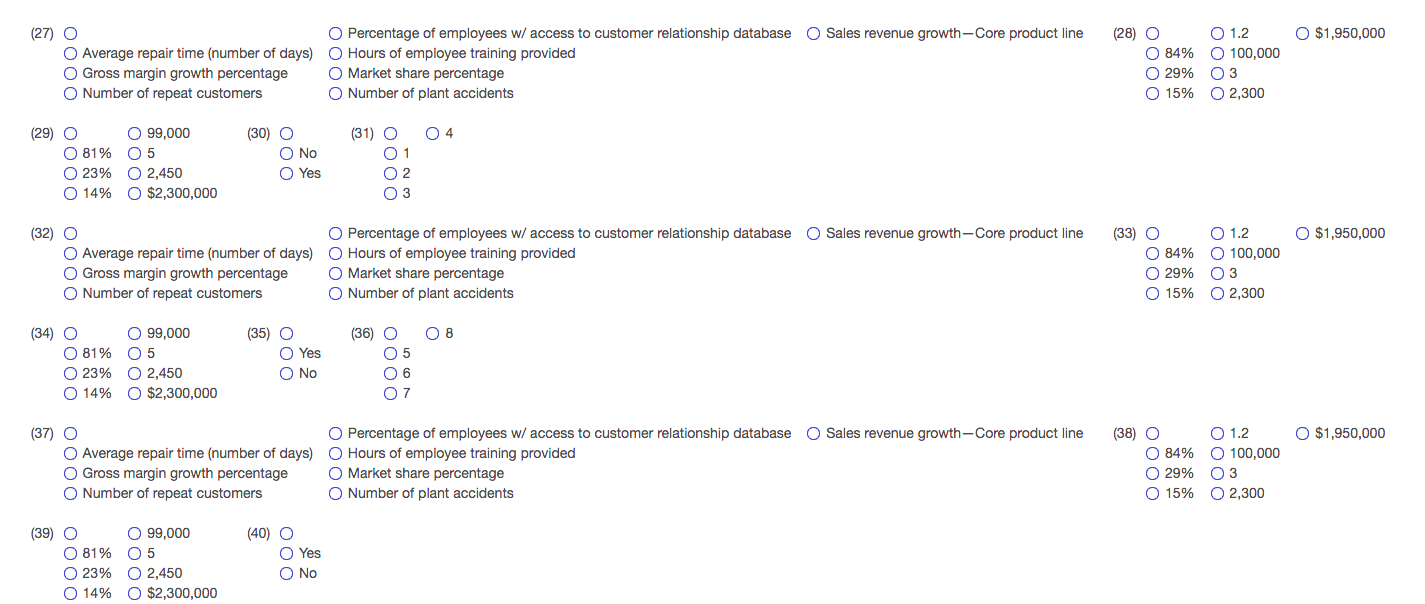
2. Rieppel Corporation is preparing its balanced Scorecard for the past quarter. The balanced Scorecard contains four perspectives: financial, customer, internal business process, and learning and growth. (Click the icon to view the specific objectives.) 2 (Click the icon to view KPls and corresponding data.) Requirement Complete the balanced Scorecard report below. (Enter the objectives using the numbers provided in the popup.) Goal Goal Actual Achieved? Rieppel Corporation Balanced Scorecard Report For Quarter Ended December 31 Perspective: Objective KPI Financial: (1) 3 (2) Sales revenue growth-Core product line (6) 5 (7) Gross margin growth percentage Customer: (11) (12) (16) (17) (4) (3) ( (8) 8) (5) (10) (9) (14) (13) (18) (15) (20) (19) Internal business process: (21) (22) (26) (27) (23) (24) (25) (28) (29) (30) Learning and growth: (31) (32) (36) (37) (33) (34) (35) (38) (39) (40) 1: Specific objectives Through its strategic management planning process, Rieppel Corporation has selected two specific objectives for each of the four perspectives. These are listed in the following table. Specific Objective 1. Improve post-sales service 2. Increase market share 3. Increase gross margin Increase number of employees with access to customer relationship 4. database 5. Increase sales of core product line 6. Increase plant safety 7. Improve employee product knowledge 8. Increase customer retention 2: KPIs and corresponding data Rieppel Corporation has collected key performance indicators (KPIs) to measure progress toward achieving its specific objectives. The following table contains the KPIs and corresponding data that Rieppel Corporation has collected for the pas quarter. KPI Goal Actual Gross margin growth percentage 29% 23% Market share percentage. 15% 14% 3 5 100,000 99,000 2,300 2,450 Number of plant accidents Number of repeat customers. Hours of employee training provided Average repair time (number of days) Sales revenue growth-Core product line. Percentage of employees w/ access to customer relationship database 1.2 1.8 $1,950,000 $2,300,000 84% 81% 3: Requirement Prepare a balanced Scorecard report for Rieppel Corporation. Place each of the specific objectives listed under the appropriate perspective heading in the report. Select a KPI from the list of KPIs that would be appropriate to measure progress toward each objective. (There are two specific objectives for each perspective and one KPI for each of the specific objectives.) In the last column of the balanced Scorecard report, select if the associated KPI goal has been achieved. 04 (1) O 0 1 2 03 (2) O Percentage of employees w/ access to customer relationship database Sales revenue growth Core product line O Average repair time (number of days) O Hours of employee training provided Gross margin growth percentage O Market share percentage O Number of repeat customers O Number of plant accidents O $1,950,000 08 (3) O O 1.2 O 84% 100,000 O 29% 03 O 15% O2,300 (4) O 99,000 O 81% 05 0 23% O2,450 14% $2,300,000 (5) O Yes O No (6) O 5 06 07 $1,950,000 (7) O O Percentage of employees w/ access to customer relationship database Sales revenue growth-Core product line Average repair time (number of days) O Hours of employee training provided O Gross margin growth percentage O Market share percentage O Number of repeat customers Number of plant accidents (8) O O 1.2 O 84% 0 100,000 29% 03 O 15% O2,300 0000 (11) O 04 (9) O 99,000 O 81% 05 O 23% O2,450 14% $2,300,000 (10) O O No O Yes WN - 3 O $1,950,000 (12) O O Percentage of employees w/ access to customer relationship database Sales revenue growth Core product line Average repair time (number of days) O Hours of employee training provided Gross margin growth percentage O Market share percentage Number of repeat customers Number of plant accidents (13) O O 1.2 O 84% 100,000 O 29% 03 O 15% O2,300 OOOO (15) 08 (14) O 99,000 O 81% 05 23% O2,450 14% $2,300,000 O No O Yes (16) O 05 06 07 7 O $1,950,000 (17) O O Percentage of employees w/ access to customer relationship database Sales revenue growth - Core product line Average repair time (number of days) O Hours of employee training provided Gross margin growth percentage O Market share percentage O Number of repeat customers O Number of plant accidents (18) O O O 1.2 O 84% 100,000 O 29% 03 O 15% O2,300 04 (19) O 99,000 O 81% 05 O 23% O2,450 O 14% 0 $2,300,000 (20) O O No O Yes (21) O 01 02 03 O $1,950,000 (22) O Percentage of employees w/ access to customer relationship database Sales revenue growth Core product line Average repair time (number of days) O Hours of employee training provided O Gross margin growth percentage O Market share percentage O Number of repeat customers Number of plant accidents (23) O O 1.2 O 84% 100,000 0 29% 03 O 15% O 2,300 (25) 08 (24) O O 1.8 81% 05 O 23% O2,450 O 14% 0 $2,300,000 O Yes O No (26) O 05 06 07 O $1,950,000 (27) O O Percentage of employees w/ access to customer relationship database Sales revenue growth-Core product line Average repair time (number of days) O Hours of employee training provided O Gross margin growth percentage O Market share percentage O Number of repeat customers O Number of plant accidents (28) O O 1.2 84% 100,000 29% 03 O 15% O2,300 04 (29) O 99,000 O 81% 05 23% O2,450 14% $2,300,000 (30) O No O Yes 000 (31) O 0 1 O2 O 3 O $1,950,000 (32) O Percentage of employees w/ access to customer relationship database Sales revenue growth Core product line Average repair time (number of days) O Hours of employee training provided O Gross margin growth percentage O Market share percentage O Number of repeat customers O Number of plant accidents (33) O O 1.2 O 84% 100,000 29% 03 O 15% O2,300 08 (34) O O99,000 O 81% 05 O 23% O2,450 14% $2,300,000 (35) O O Yes O No (36) O 5 06 07 (38) O $1,950,000 (37) O O Percentage of employees w/ access to customer relationship database Sales revenue growth Core product line Average repair time (number of days) O Hours of employee training provided O Gross margin growth percentage O Market share percentage O Number of repeat customers Number of plant accidents O 1.2 84% 100,000 O 29% 03 O 15% O2,300 (39) O 99,000 O 81% 05 O 23% O2,450 O 14% $2,300,000 (40) O O Yes 2. Rieppel Corporation is preparing its balanced Scorecard for the past quarter. The balanced Scorecard contains four perspectives: financial, customer, internal business process, and learning and growth. (Click the icon to view the specific objectives.) 2 (Click the icon to view KPls and corresponding data.) Requirement Complete the balanced Scorecard report below. (Enter the objectives using the numbers provided in the popup.) Goal Goal Actual Achieved? Rieppel Corporation Balanced Scorecard Report For Quarter Ended December 31 Perspective: Objective KPI Financial: (1) 3 (2) Sales revenue growth-Core product line (6) 5 (7) Gross margin growth percentage Customer: (11) (12) (16) (17) (4) (3) ( (8) 8) (5) (10) (9) (14) (13) (18) (15) (20) (19) Internal business process: (21) (22) (26) (27) (23) (24) (25) (28) (29) (30) Learning and growth: (31) (32) (36) (37) (33) (34) (35) (38) (39) (40) 1: Specific objectives Through its strategic management planning process, Rieppel Corporation has selected two specific objectives for each of the four perspectives. These are listed in the following table. Specific Objective 1. Improve post-sales service 2. Increase market share 3. Increase gross margin Increase number of employees with access to customer relationship 4. database 5. Increase sales of core product line 6. Increase plant safety 7. Improve employee product knowledge 8. Increase customer retention 2: KPIs and corresponding data Rieppel Corporation has collected key performance indicators (KPIs) to measure progress toward achieving its specific objectives. The following table contains the KPIs and corresponding data that Rieppel Corporation has collected for the pas quarter. KPI Goal Actual Gross margin growth percentage 29% 23% Market share percentage. 15% 14% 3 5 100,000 99,000 2,300 2,450 Number of plant accidents Number of repeat customers. Hours of employee training provided Average repair time (number of days) Sales revenue growth-Core product line. Percentage of employees w/ access to customer relationship database 1.2 1.8 $1,950,000 $2,300,000 84% 81% 3: Requirement Prepare a balanced Scorecard report for Rieppel Corporation. Place each of the specific objectives listed under the appropriate perspective heading in the report. Select a KPI from the list of KPIs that would be appropriate to measure progress toward each objective. (There are two specific objectives for each perspective and one KPI for each of the specific objectives.) In the last column of the balanced Scorecard report, select if the associated KPI goal has been achieved. 04 (1) O 0 1 2 03 (2) O Percentage of employees w/ access to customer relationship database Sales revenue growth Core product line O Average repair time (number of days) O Hours of employee training provided Gross margin growth percentage O Market share percentage O Number of repeat customers O Number of plant accidents O $1,950,000 08 (3) O O 1.2 O 84% 100,000 O 29% 03 O 15% O2,300 (4) O 99,000 O 81% 05 0 23% O2,450 14% $2,300,000 (5) O Yes O No (6) O 5 06 07 $1,950,000 (7) O O Percentage of employees w/ access to customer relationship database Sales revenue growth-Core product line Average repair time (number of days) O Hours of employee training provided O Gross margin growth percentage O Market share percentage O Number of repeat customers Number of plant accidents (8) O O 1.2 O 84% 0 100,000 29% 03 O 15% O2,300 0000 (11) O 04 (9) O 99,000 O 81% 05 O 23% O2,450 14% $2,300,000 (10) O O No O Yes WN - 3 O $1,950,000 (12) O O Percentage of employees w/ access to customer relationship database Sales revenue growth Core product line Average repair time (number of days) O Hours of employee training provided Gross margin growth percentage O Market share percentage Number of repeat customers Number of plant accidents (13) O O 1.2 O 84% 100,000 O 29% 03 O 15% O2,300 OOOO (15) 08 (14) O 99,000 O 81% 05 23% O2,450 14% $2,300,000 O No O Yes (16) O 05 06 07 7 O $1,950,000 (17) O O Percentage of employees w/ access to customer relationship database Sales revenue growth - Core product line Average repair time (number of days) O Hours of employee training provided Gross margin growth percentage O Market share percentage O Number of repeat customers O Number of plant accidents (18) O O O 1.2 O 84% 100,000 O 29% 03 O 15% O2,300 04 (19) O 99,000 O 81% 05 O 23% O2,450 O 14% 0 $2,300,000 (20) O O No O Yes (21) O 01 02 03 O $1,950,000 (22) O Percentage of employees w/ access to customer relationship database Sales revenue growth Core product line Average repair time (number of days) O Hours of employee training provided O Gross margin growth percentage O Market share percentage O Number of repeat customers Number of plant accidents (23) O O 1.2 O 84% 100,000 0 29% 03 O 15% O 2,300 (25) 08 (24) O O 1.8 81% 05 O 23% O2,450 O 14% 0 $2,300,000 O Yes O No (26) O 05 06 07 O $1,950,000 (27) O O Percentage of employees w/ access to customer relationship database Sales revenue growth-Core product line Average repair time (number of days) O Hours of employee training provided O Gross margin growth percentage O Market share percentage O Number of repeat customers O Number of plant accidents (28) O O 1.2 84% 100,000 29% 03 O 15% O2,300 04 (29) O 99,000 O 81% 05 23% O2,450 14% $2,300,000 (30) O No O Yes 000 (31) O 0 1 O2 O 3 O $1,950,000 (32) O Percentage of employees w/ access to customer relationship database Sales revenue growth Core product line Average repair time (number of days) O Hours of employee training provided O Gross margin growth percentage O Market share percentage O Number of repeat customers O Number of plant accidents (33) O O 1.2 O 84% 100,000 29% 03 O 15% O2,300 08 (34) O O99,000 O 81% 05 O 23% O2,450 14% $2,300,000 (35) O O Yes O No (36) O 5 06 07 (38) O $1,950,000 (37) O O Percentage of employees w/ access to customer relationship database Sales revenue growth Core product line Average repair time (number of days) O Hours of employee training provided O Gross margin growth percentage O Market share percentage O Number of repeat customers Number of plant accidents O 1.2 84% 100,000 O 29% 03 O 15% O2,300 (39) O 99,000 O 81% 05 O 23% O2,450 O 14% $2,300,000 (40) O O Yes