

Answered step by step
Verified Expert Solution
Question
1 Approved Answer
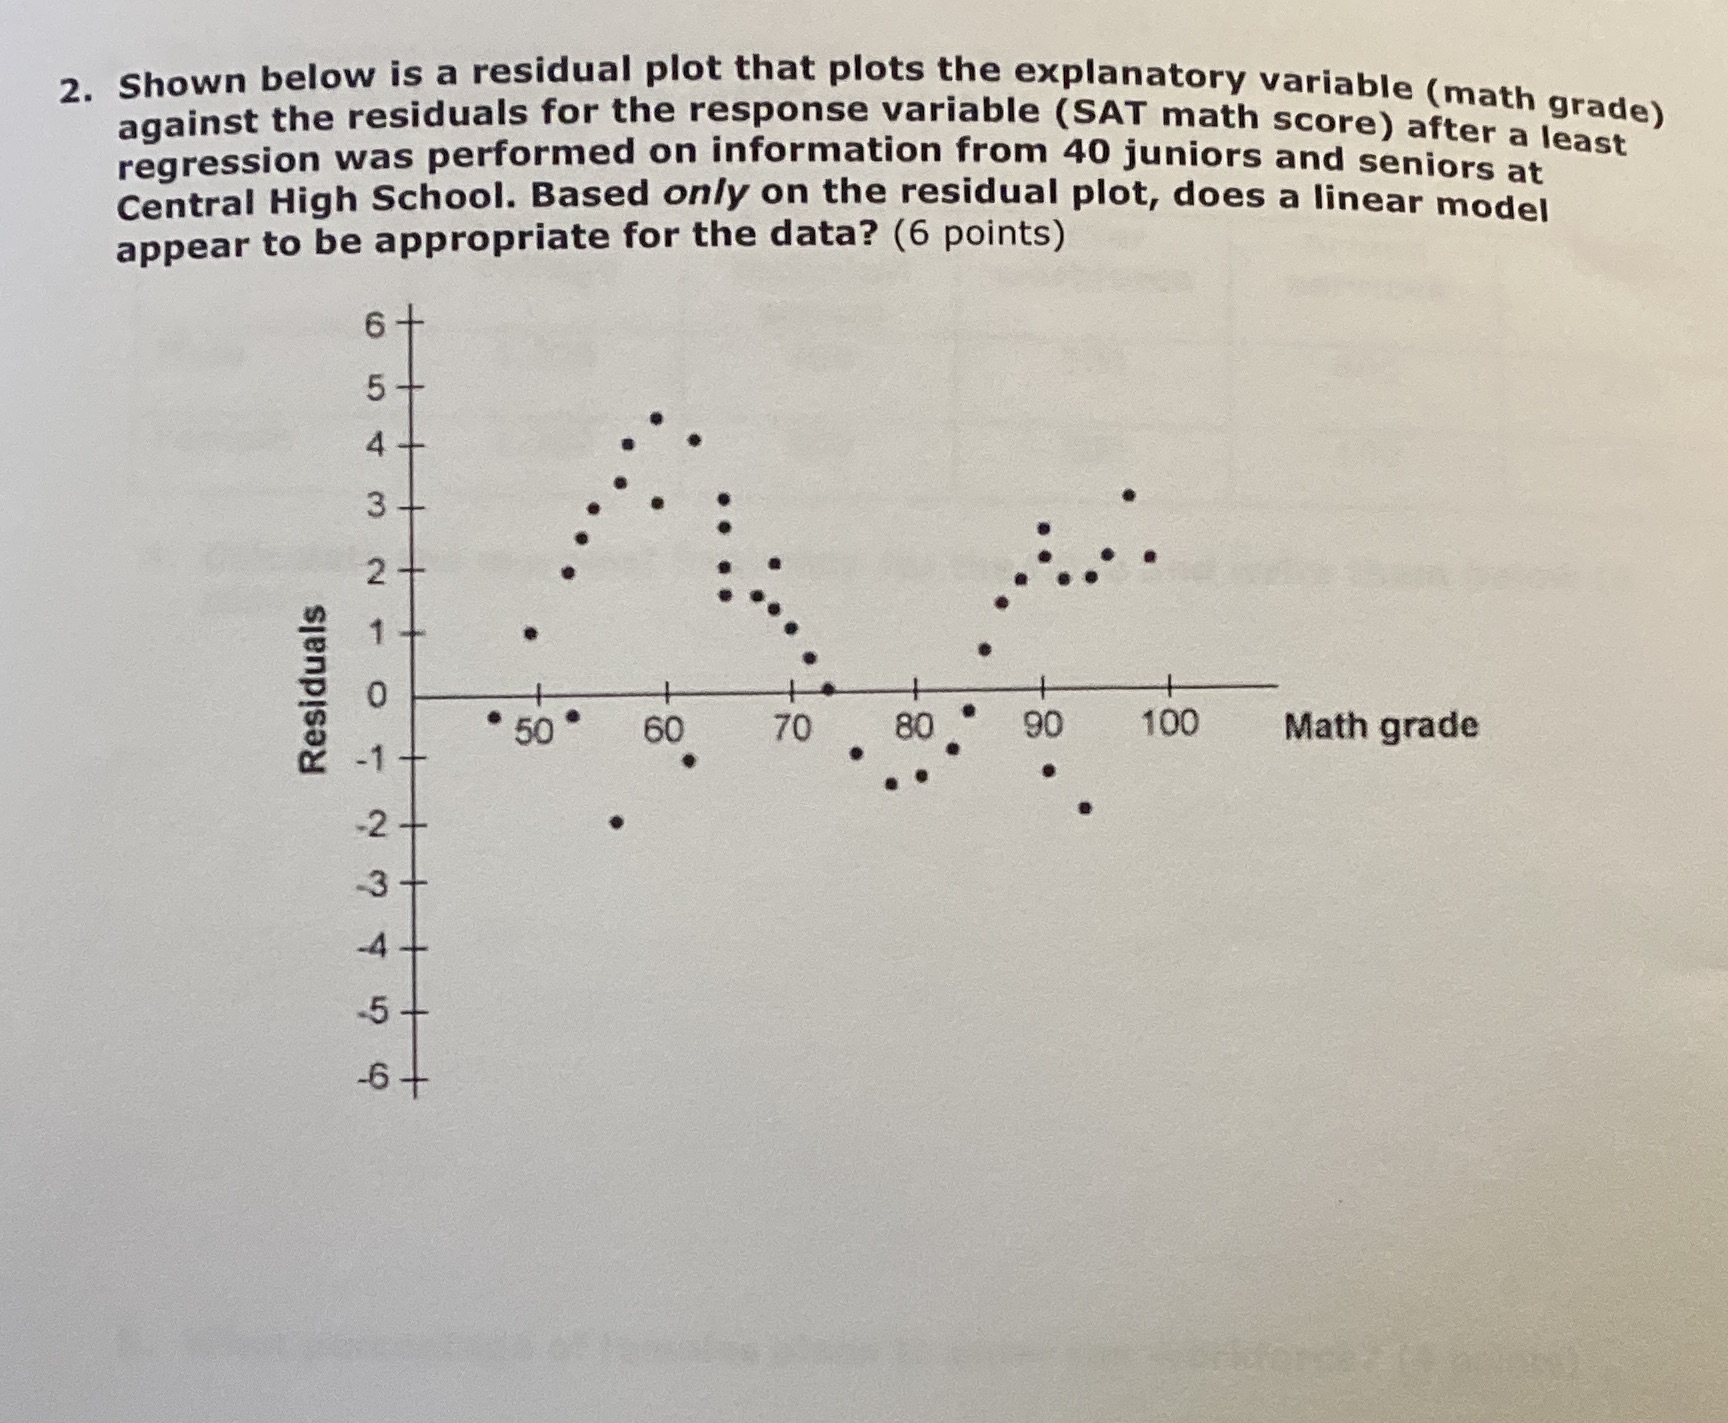
2. Shown below is a residual plot that plots the explanatory variable (math grade) against the residuals for the response variable (SAT math score) after
Step by Step Solution
There are 3 Steps involved in it
Step: 1

Get Instant Access to Expert-Tailored Solutions
See step-by-step solutions with expert insights and AI powered tools for academic success
Step: 2

Step: 3
Ace Your Homework with AI
Get the answers you need in no time with our AI-driven, step-by-step assistance
Get Started
Statistics The Art And Science Of Learning From Data
Authors: Alan Agresti, Christine A. Franklin
3rd Edition
9780321849281, 321755944, 321849280, 978-0321755940