6. Geese counting part I - Model diagnostics Experienced observers use aerial survey methods to estimate the number of snow geese in their summer range
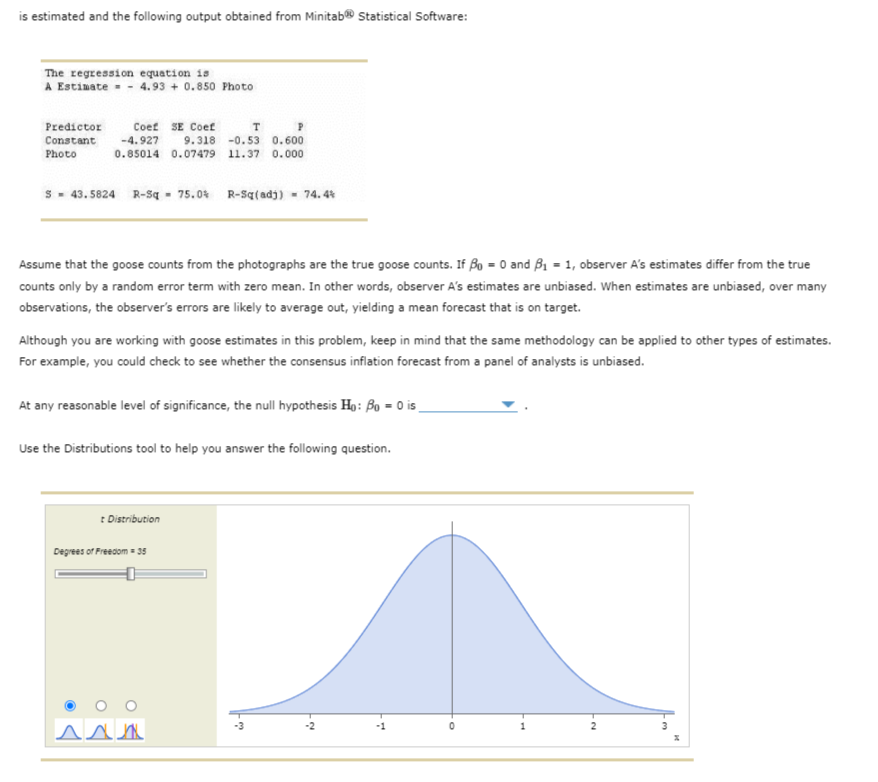
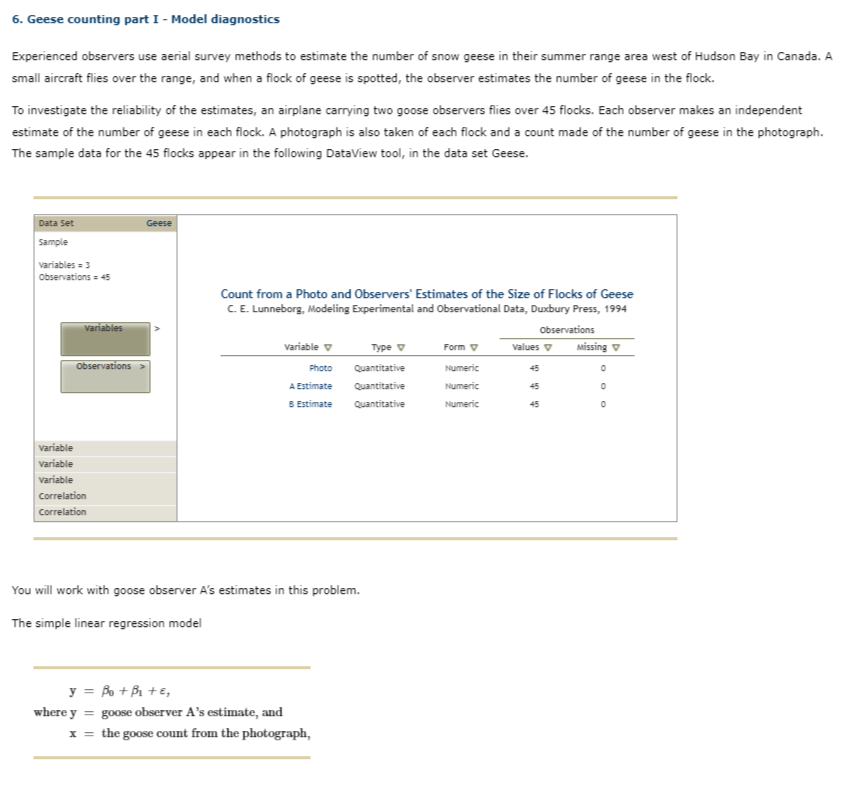
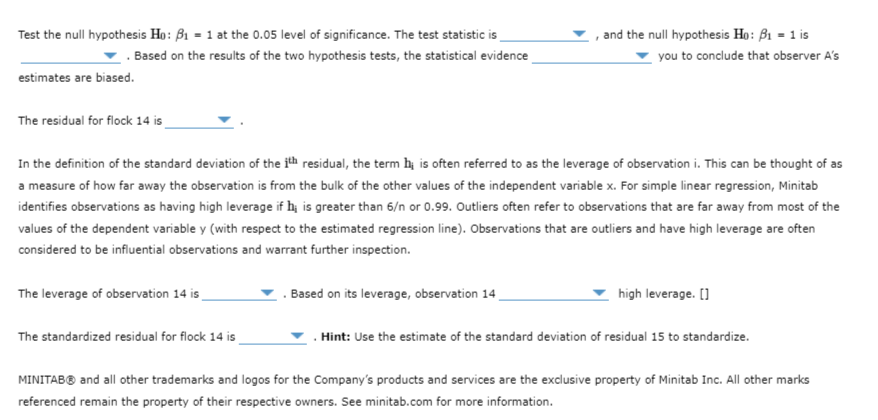
6. Geese counting part I - Model diagnostics Experienced observers use aerial survey methods to estimate the number of snow geese in their summer range area west of Hudson Bay in Canada. A small aircraft flies over the range, and when a flock of geese is spotted, the observer estimates the number of geese in the flock. To investigate the reliability of the estimates, an airplane carrying two goose observers flies over 45 flocks. Each observer makes an independent estimate of the number of geese in each flock. A photograph is also taken of each flock and a count made of the number of geese in the photograph. The sample data for the 45 flocks appear in the following DataView tool, in the data set Geese. Data Set Geese Sample variables = 3 Observations = 45 Count from a Photo and Observers' Estimates of the Size of Flocks of Geese C. E. Lunneborg, Modeling Experimental and Observational Data, Duxbury Press, 1994 variables Observations variable Type Form Values Missing Observations Photo Quantitative Numeric A Estimate Quantitative Numeric B Estimate Quantitative Numeric variable variable variable Correlation Correlation You will work with goose observer A's estimates in this problem. The simple linear regression model where y = goose observer A's estimate, and x = the goose count from the photograph,is estimated and the following output obtained from Minitab Statistical Software: The regression equation is A Estimate = - 4.93 + 0.850 Photo Predictor Coel SE Coel T Constant -4.927 9. 318 -0.53 0.600 Photo 0. 85014 0. 07479 11.37 0.000 5 - 43. 5824 R-Sq - 75.04 R-Sq(adj) = 74.4% Assume that the goose counts from the photographs are the true goose counts. If Bo = 0 and 81 = 1, observer A's estimates differ from the true counts only by a random error term with zero mean. In other words, observer A's estimates are unbiased. When estimates are unbiased, over many observations, the observer's errors are likely to average out, yielding a mean forecast that is on target. Although you are working with goose estimates in this problem, keep in mind that the same methodology can be applied to other types of estimates. For example, you could check to see whether the consensus inflation forecast from a panel of analysts is unbiased. At any reasonable level of significance, the null hypothesis Ho: Bo = 0 is Use the Distributions tool to help you answer the following question. : Distribution Degrees of Freedom = 39 O -3 -2 -1 N -Test the null hypothesis Ho: 81 = 1 at the 0.05 level of significance. The test statistic is , and the null hypothesis Ho: 81 = 1 is . Based on the results of the two hypothesis tests, the statistical evidence you to conclude that observer A's estimates are biased. The residual for flock 14 is In the definition of the standard deviation of the ith residual, the term h; is often referred to as the leverage of observation i. This can be thought of as a measure of how far away the observation is from the bulk of the other values of the independent variable x. For simple linear regression, Minitab identifies observations as having high leverage if h; is greater than 6 or 0.99. Outliers often refer to observations that are far away from most of the values of the dependent variable y (with respect to the estimated regression line). Observations that are outliers and have high leverage are often considered to be influential observations and warrant further inspection. The leverage of observation 14 is . Based on its leverage, observation 14 high leverage. The standardized residual for flock 14 is . Hint: Use the estimate of the standard deviation of residual 15 to standardize. MINITAB@ and all other trademarks and logos for the Company's products and services are the exclusive property of Minitab Inc. All other marks referenced remain the property of their respective owners. See minitab.com for more information
Step by Step Solution
There are 3 Steps involved in it
Step: 1
Get Instant Access to Expert-Tailored Solutions
See step-by-step solutions with expert insights and AI powered tools for academic success
Step: 2
Step: 3
Ace Your Homework with AI
Get the answers you need in no time with our AI-driven, step-by-step assistance