

Answered step by step
Verified Expert Solution
Question
1 Approved Answer
2. Statistical measures of standalone risk Remember, the expected value of a probability distribution is a statistical measure of the average (mean) value expected to
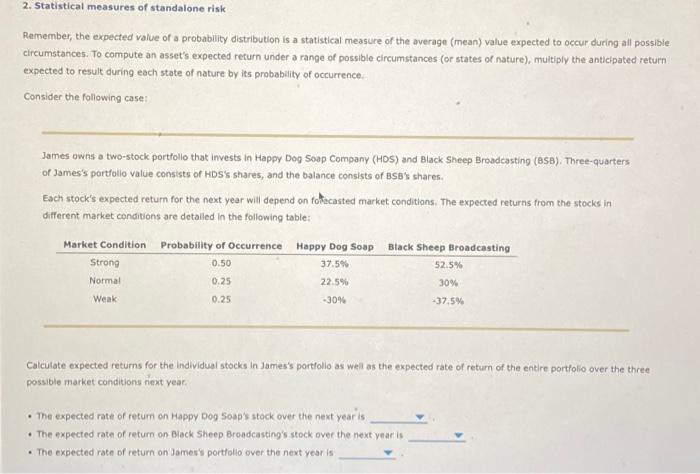
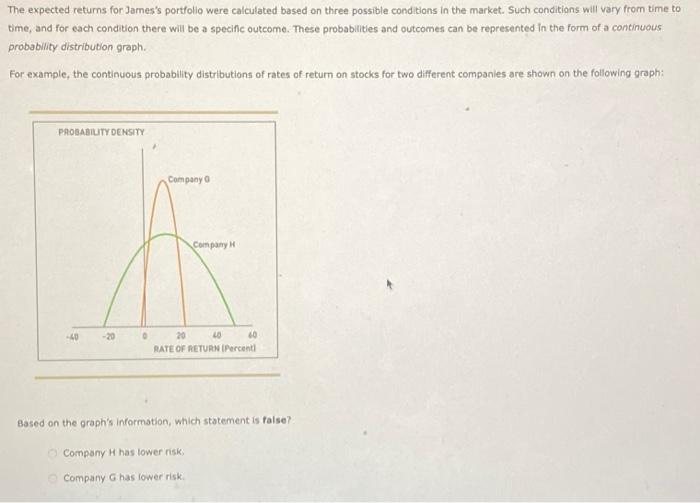 2. Statistical measures of standalone risk Remember, the expected value of a probability distribution is a statistical measure of the average (mean) value expected to occur during all possible. circumstances. To compute an asset's expected return under a range of possible circumstances (or states of nature), multiply the anticipated return expected to result during each state of nature by its probability of occurrence. Consider the following case: James owns a two-stock portfollo that invests in Happy Dog Soap Company (HOS) and Black Sheep Broadcasting (BSB). Three-quarters of James's portfollo value consists of HDS's shares, and the balance consists of BSB's shares. Each stock's expected return for the next year will depend on folacasted market conditions. The expected returns from the stocks in different market conditions are detalled in the following table: Calculate expected returns for the individual stocks in James's portfolio as well as the expected rate of return of the entire portfolio over the three possible market conditions next year. - The expected rate of return on Happy Dog Soap's stock over the next year is - The expected rate of return on Black Sheep Broadcasting's stock over the next year is - The expected rate of return on James's portfollo over the next year is The expected returns for James's portfolio were calculated based on three possible conditions in the market. Such conditions will vary from time to time, and for each condition there will be a specifc outcome. These probabilities and outcomes can be represented in the form of a continuous: probability distribution graph. For example, the continuous probablity distributions of rates of return on stocks for two different companles are shown on the following graph: Based on the graph's information, which statement is false? Company H has lower risk, Company o has iover riek
Step by Step Solution
There are 3 Steps involved in it
Step: 1

Get Instant Access to Expert-Tailored Solutions
See step-by-step solutions with expert insights and AI powered tools for academic success
Step: 2

Step: 3
Ace Your Homework with AI
Get the answers you need in no time with our AI-driven, step-by-step assistance
Get Started
The Franchise Handbook A Complete Guide To All Aspects Of Buying Selling Or Investing In A Franchise
Authors: Atlantic Publishing Co
1st Edition
0910627541, 978-0910627542