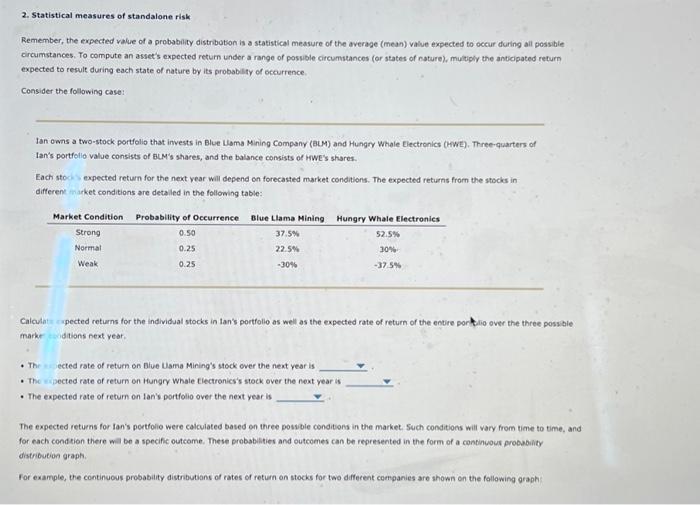
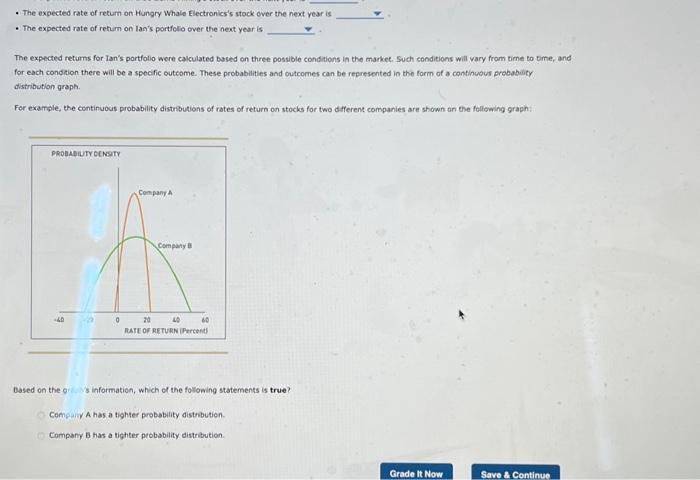
2. Statistical measures of standalone risk Remember, the expected value of a probability distribution is a statistical measure of the average (mean) value expected to occur during all possible circumstances. To compute an asset's expected return under a range of possible circumstances (or states of nature), multiply the anticipated return expected to result during each state of nature by its probability of occurrence. Consider the following case: Ian owns a two-stock portfolio thst invests in Blue Lama Mining Company (BUM) and Hungry Whale Electronics (HwE). Three-quarters of lan's portfollo value consists of BuM's shaces, and the balance consists of riwE's shares. Each stoci - expected return for the next vear will depend on forecasted market conditions. The expected returns from the stocks in differen tharket conditions are detaled in the following table: Calculat spected returns for the individual stocks in tan's portfolio as well as the expected rate of return of the entire porklio over the three possible marke idions next year. - Thr ected rate of retum on Blue Uama Mining's stock over the next year is - The wected rate of return on Hungry whale flectronics's stock over the noxt year is - The expected rate of retum on lan's portfolio over the next year is The expected returns for Ian's pertfolie were calculated based on three posvble cenditions in the market. Such conditions will vary from time to time, and for each condtion there wa be a specific outcome. These probablities and outcomes can be represented in the form of a continuous probabily distribution graph. For example, the continuous probability distrbutians of rates of return on stocks for two different companies are shown on the following graph: - The expected rate of retum on Hungry Whale Electronics's stock over the next year is - The expected rate of rehum on lan's portfolio over the next year is The expected returns for Ian's portfolio were calculated based on three possible conditions in the market. Such conditions will vary from time to time, and for each condition there will be a specific outcome. These probabilities and outcomes can be represented in the form of a continuous probability distribution graph. For example, the continuous probability distributions of rates of return on stocks for two different companies are shown an the following graph: Based on the or is information, which of the following statements is true? Compary A has a tighter probability distrbution. Company b has a tighter probabitity distribution