

Answered step by step
Verified Expert Solution
Question
1 Approved Answer
2. Statistical measures of stand-alone risk Remember, the expected value of a probability distribution is a statistical measure of the average (mean) value expected to
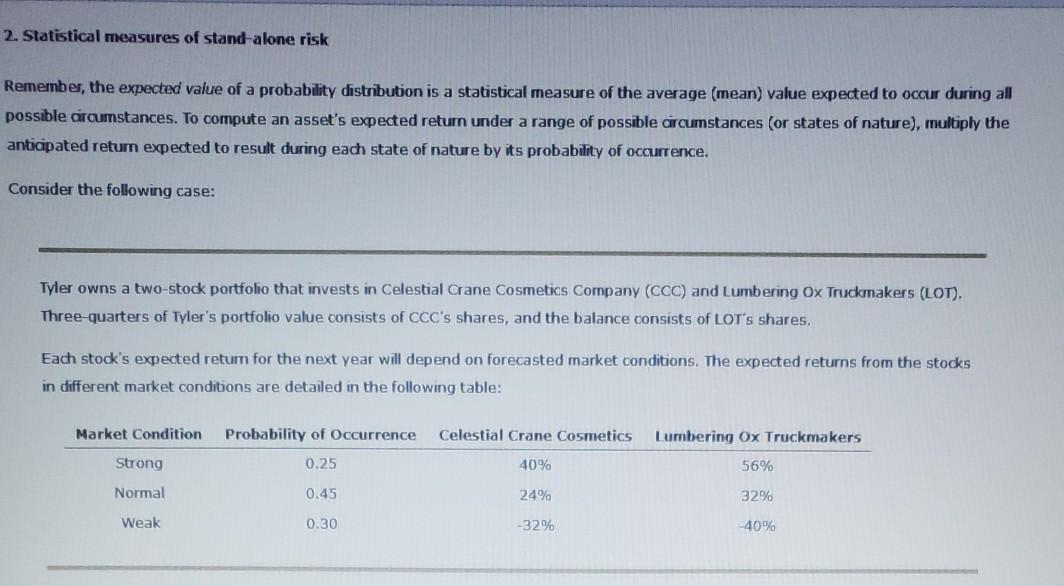
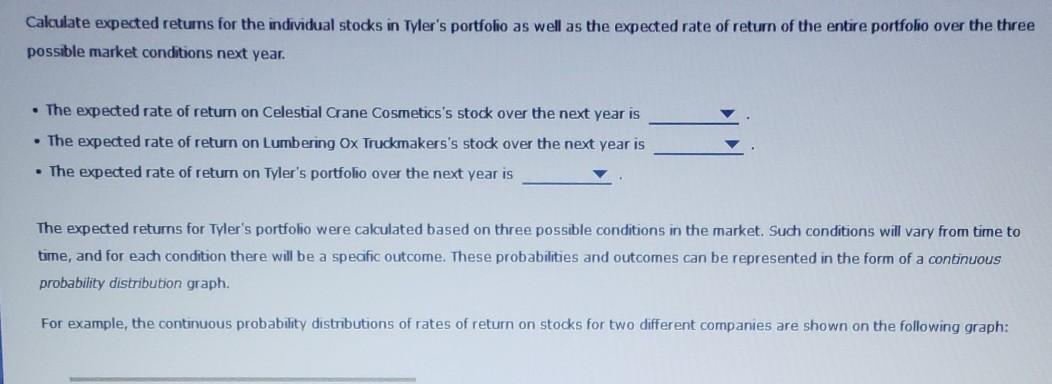
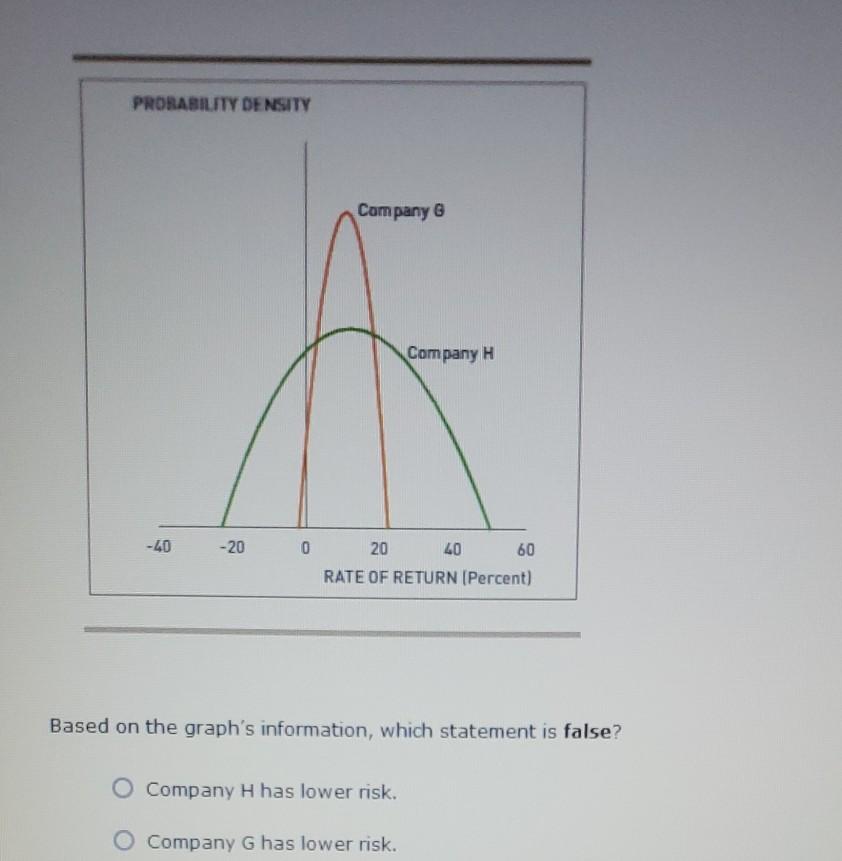
2. Statistical measures of stand-alone risk Remember, the expected value of a probability distribution is a statistical measure of the average (mean) value expected to occur during all possible circumstances. To compute an asset's expected return under a range of possible circumstances (or states of nature), multiply the anticipated return expected to result during each state of nature by its probability of occurrence. Consider the following case: Tyler owns a two-stock portfolio that invests in Celestial Crane Cosmetics Company (CCC) and Lumbering Ox Truckmakers (LOT). Three-quarters of Tyler's portfolio value consists of CCC's shares, and the balance consists of LOT's shares. Each stock's expected return for the next year will depend on forecasted market conditions. The expected returns from the stocks in different market conditions are detailed in the following table: Market Condition Probability of Occurrence Celestial Crane Cosmetics Lumbering Ox Truckmakers 56% Strong 0.25 40% Normal 0.45 24% 32% Weak 0.30 -32% -40% Calculate expected returns for the individual stocks in Tyler's portfolio as well as the expected rate of return of the entire portfolio over the three possible market conditions next year. The expected rate of return on Celestial Crane Cosmetics's stock over the next year is . The expected rate of return on Lumbering Ox Truckmakers's stock over the next year is . The expected rate of return on Tyler's portfolo over the next year is The expected returns for Tyler's portfolio were calculated based on three possible conditions in the market. Such conditions will vary from time to time, and for each condition there will be a specific outcome. These probabilities and outcomes can be represented in the form of a continuous probability distribution graph. For example, the continuous probability distributions of rates of return on stocks for two different companies are shown on the following graph: PRORABILITY DENSITY Company G Company H -40 -20 0 20 40 60 RATE OF RETURN (Percent) Based on the graph's information, which statement is false? O Company H has lower risk. Company G has lower risk
Step by Step Solution
There are 3 Steps involved in it
Step: 1

Get Instant Access to Expert-Tailored Solutions
See step-by-step solutions with expert insights and AI powered tools for academic success
Step: 2

Step: 3
Ace Your Homework with AI
Get the answers you need in no time with our AI-driven, step-by-step assistance
Get Started
Communication Essentials For Financial Planners
Authors: John E. Grable
1st Edition
1119350786, 978-1119350781