

Answered step by step
Verified Expert Solution
Question
1 Approved Answer
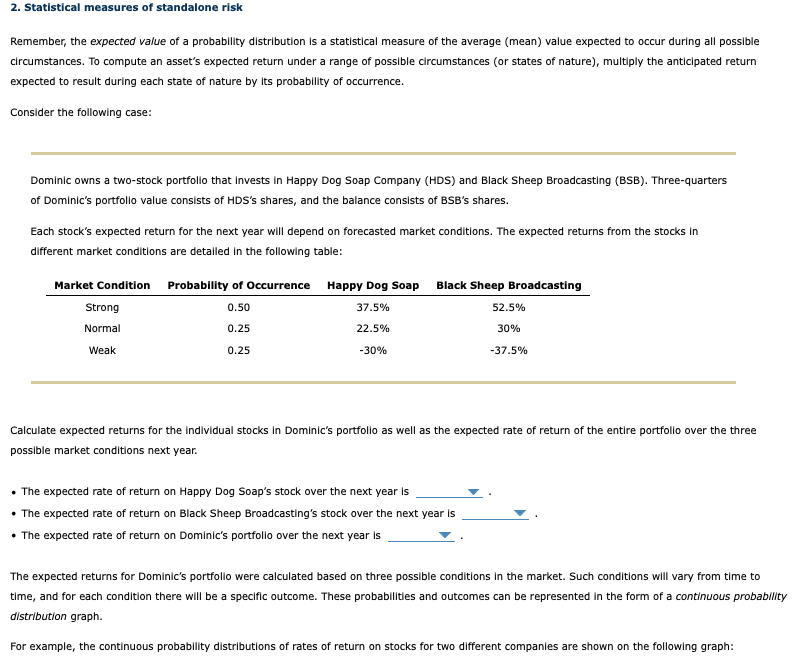
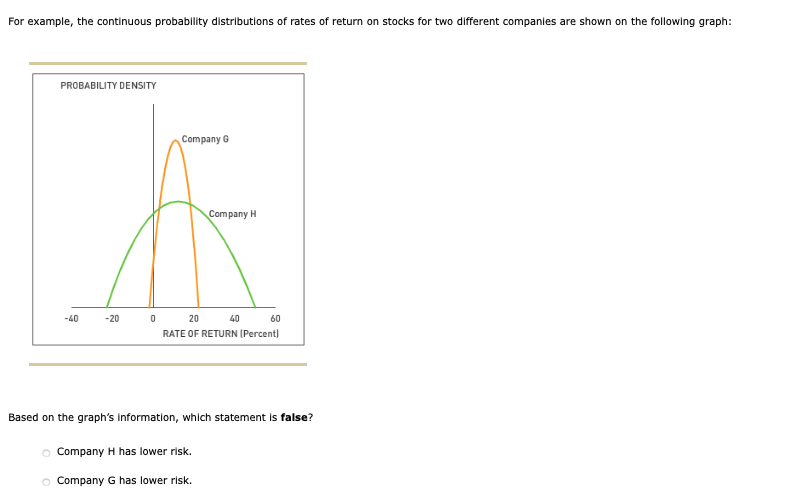
2. Statistical measures of standalone risk Remember, the expected value of a probability distribution is a statistical measure of the average (mean) value expected to
Step by Step Solution
There are 3 Steps involved in it
Step: 1

Get Instant Access to Expert-Tailored Solutions
See step-by-step solutions with expert insights and AI powered tools for academic success
Step: 2

Step: 3
Ace Your Homework with AI
Get the answers you need in no time with our AI-driven, step-by-step assistance
Get Started
Guide To Finance Theory And Application Portfolio Mathematics
Authors: Professional Risk Managers' International Association (PRMIA)
1st Edition
0071731814