

Answered step by step
Verified Expert Solution
Question
1 Approved Answer
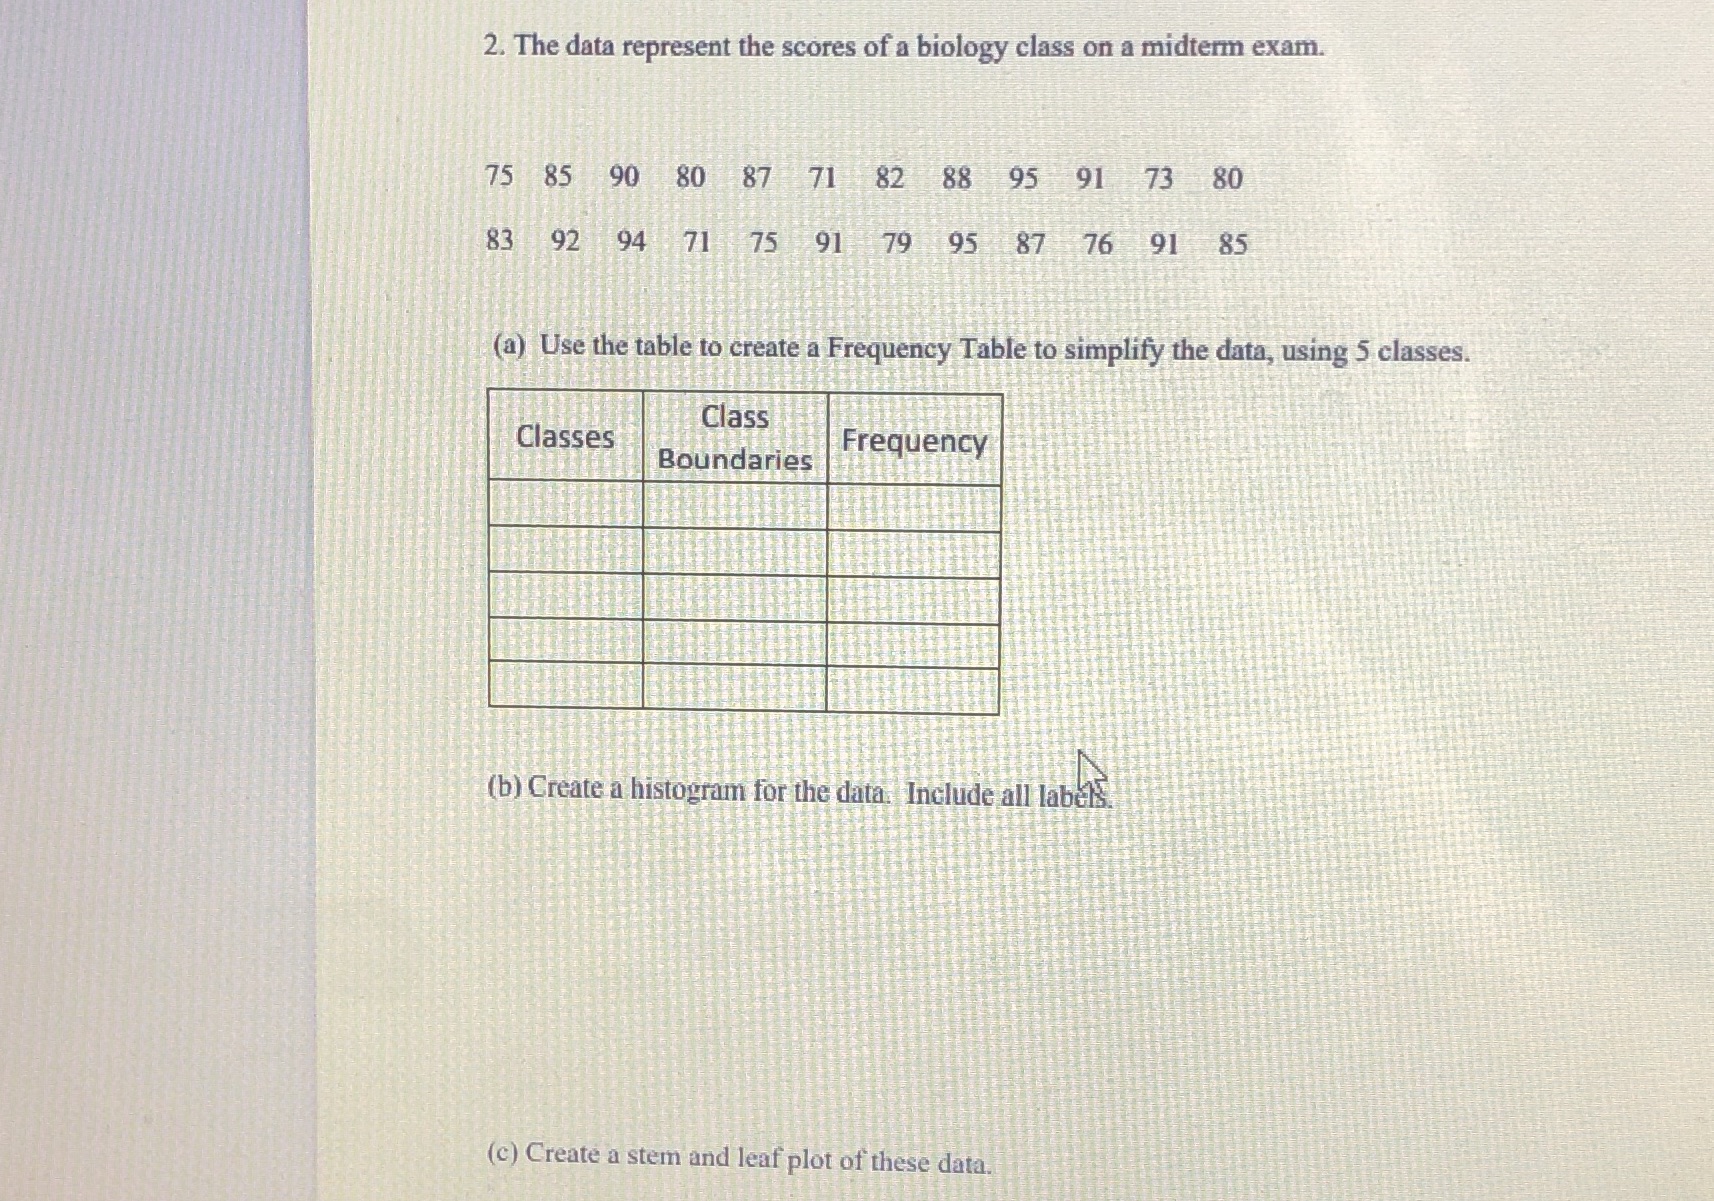
2. The data represent the scores of a biology class on a midterm exam. 75 85 90 80 87 71 82 88 95 91 73
Step by Step Solution
There are 3 Steps involved in it
Step: 1

Get Instant Access to Expert-Tailored Solutions
See step-by-step solutions with expert insights and AI powered tools for academic success
Step: 2

Step: 3
Ace Your Homework with AI
Get the answers you need in no time with our AI-driven, step-by-step assistance
Get Started
Precalculus, Enhanced
Authors: Cynthia Y Young
3rd Edition
1119339510, 9781119339519