

Answered step by step
Verified Expert Solution
Question
1 Approved Answer
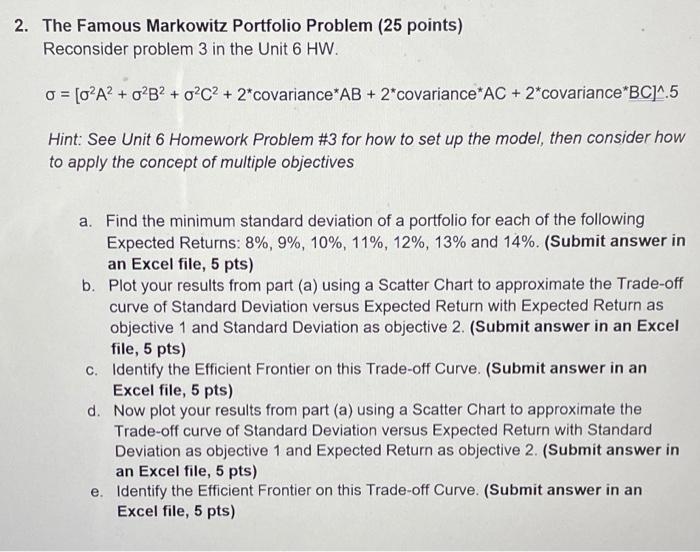
2. The Famous Markowitz Portfolio Problem (25 points) Reconsider problem 3 in the Unit 6 HW. o = [oA? + o?B? + oC2 + 2*covariance
Step by Step Solution
There are 3 Steps involved in it
Step: 1

Get Instant Access to Expert-Tailored Solutions
See step-by-step solutions with expert insights and AI powered tools for academic success
Step: 2

Step: 3
Ace Your Homework with AI
Get the answers you need in no time with our AI-driven, step-by-step assistance
Get Started
Port Infrastructure Finance
Authors: Hilde Meersman, Eddy Van De Voorde, Thierry Vanelslander
1st Edition
0415720060, 978-0415720069