Answered step by step
Verified Expert Solution
Link Copied!

Question

1 Approved Answer

2. The figure shows the graphical model of a linear program. The large numbers on the right (1,2, and 3) indicate the constraints The feasible
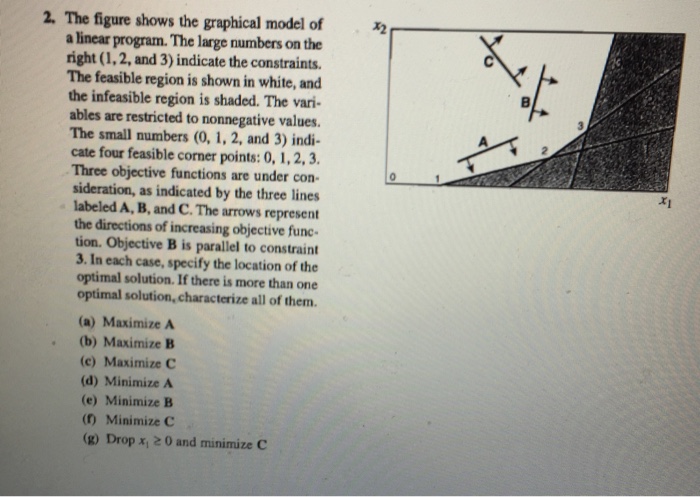
image text in transcribed
2. The figure shows the graphical model of a linear program. The large numbers on the right (1,2, and 3) indicate the constraints The feasible region is shown in white, and the infeasible region is shaded. The vari- ables are restricted to nonnegative values. The small numbers (0, 1, 2, and 3) indi- cate four feasible corner points: 0, 1,2,3 Three objective functions are under con- sideration, as indicated by the three lines labeled A, B, and C. The arrows represent the directions of increasing objective func- tion. Objective B is parallel to constraint 3. In each case, specify the location of the optimal solution. If there is more than one optimal solution, characterize all of them. (a) Maximize A (b) Maximize B (c) Maximize C (d) Minimize A (e) Minimize B (0) Minimize C (g) Drop x, 2 0 and minimize C

Step by Step Solution

There are 3 Steps involved in it

Step: 1

blur-text-image

Get Instant Access to Expert-Tailored Solutions

See step-by-step solutions with expert insights and AI powered tools for academic success

Step: 2

blur-text-image

Step: 3

blur-text-image

Ace Your Homework with AI

Get the answers you need in no time with our AI-driven, step-by-step assistance

Get Started

Recommended Textbook for

The Database Experts Guide To SQL

Authors: Frank Lusardi

1st Edition

0070390029, 978-0070390027

More Books

Students also viewed these Databases questions