

Answered step by step
Verified Expert Solution
Question
1 Approved Answer
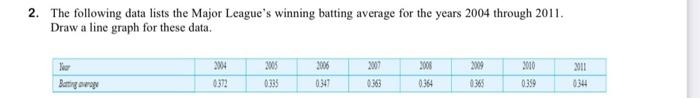
2. The following data lists the Major League's winning batting average for the years 2004 through 2011. Draw a line graph for these data. 27
Step by Step Solution
There are 3 Steps involved in it
Step: 1

Get Instant Access to Expert-Tailored Solutions
See step-by-step solutions with expert insights and AI powered tools for academic success
Step: 2

Step: 3
Ace Your Homework with AI
Get the answers you need in no time with our AI-driven, step-by-step assistance
Get Started
Evidence Based Audit In General Practice
Authors: Richard Baker, Robin C. Fraser MD FRCGP, Mayur Lakhani MRCP MRCGP DCH
1st Edition
075063104X, 978-0750631044