2. The following describes the data in the Tasktime.mtw worksheet saved on your data disc. A random sample of cleaning workers was taken and the
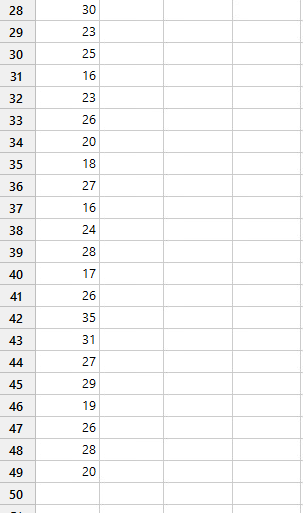
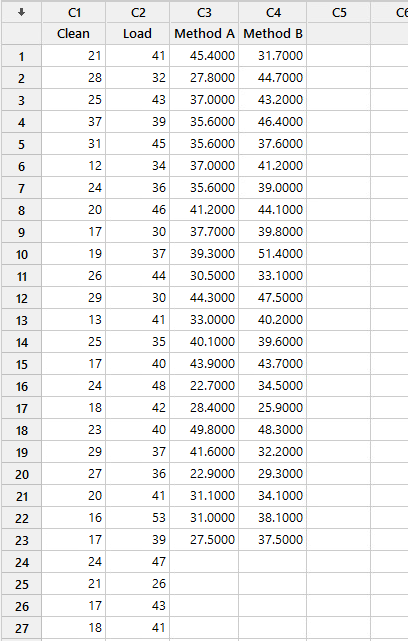
2. The following describes the data in the Tasktime.mtw worksheet saved on your data disc. A random sample of "cleaning" workers was taken and the time (in minutes) required to clean the production machine was recorded. Another sample of "loading" workers was taken and the time (in minutes) to load the raw materials into the machine was recorded. The distribution of load times among all workers is normal. Then twenty-three workers from the Method A assembly line were randomly selected, and their production times (in minutes) were measured. Then these same workers were moved to the Method B assembly line, and their production times (in minutes) were measured. It is known that production times by either of these two methods are normally distributed. a. Open the worksheet Tasktime.mtw that is on your data disc. b. Compute a 90% confidence interval for the mean loading time of all "loading" workers (who load the raw materials into the machine). c. Compute a 98% confidence interval for the mean production time by all workers from the Method B assembly line. 3. The distribution of late arrival times by all Gamma Airlines flights is normally distributed with a population standard deviation of 12 minutes. A random sample of late Gamma Airline flights was taken, and the results are: 25, 14, 7, 1, 3, 34, 60, 37, 28, 18, 23, 34, 41 and 8 minutes. Open a new Worksheet Window, enter the data, and find a 95% confidence interval for the mean late arrival time for all late Gamma Airline flights. If the airline industry standards are: (a) Excellent - 0 to under 15 minutes late, (b) Good - 15 to under 40 minutes late, and (c) Poor - 40 or more minutes late; how would you describe Gamma Airlines performance (Excellent, Good or Poor)?28 30 29 23 30 25 31 16 32 23 33 26 34 20 35 18 36 27 37 16 38 24 39 28 40 17 41 26 42 35 43 31 44 27 45 29 46 19 47 26 48 28 49 20 50C1 C2 C3 C4 C5 CF Clean Load Method A Method B 21 41 45.4000 31.7000 28 32 27.8000 44.7000 W 25 43 37.0000 43.2000 4 37 39 35.6000 46.4000 5 31 45 35.6000 37.6000 6 12 34 37.0000 41.2000 24 36 35.6000 39.0000 8 20 46 41.2000 44.1000 9 17 30 37.7000 39.8000 10 19 37 39.3000 51.4000 11 26 44 30.5000 33.1000 12 29 30 44.3000 47.5000 13 13 41 33.0000 40.2000 14 25 35 40.1000 39.6000 15 17 40 43.9000 43.7000 16 24 48 22.7000 34.5000 17 18 42 28.4000 25.9000 18 23 40 49.8000 48.3000 19 29 37 41.6000 32.2000 20 27 36 22.9000 29.3000 21 20 41 31.1000 34.1000 22 16 53 31.0000 38.1000 23 17 39 27.5000 37.5000 24 24 47 25 21 26 26 17 43 27 18 41
Step by Step Solution
There are 3 Steps involved in it
Step: 1
Get Instant Access to Expert-Tailored Solutions
See step-by-step solutions with expert insights and AI powered tools for academic success
Step: 2
Step: 3
Ace Your Homework with AI
Get the answers you need in no time with our AI-driven, step-by-step assistance