

Answered step by step
Verified Expert Solution
Question
1 Approved Answer
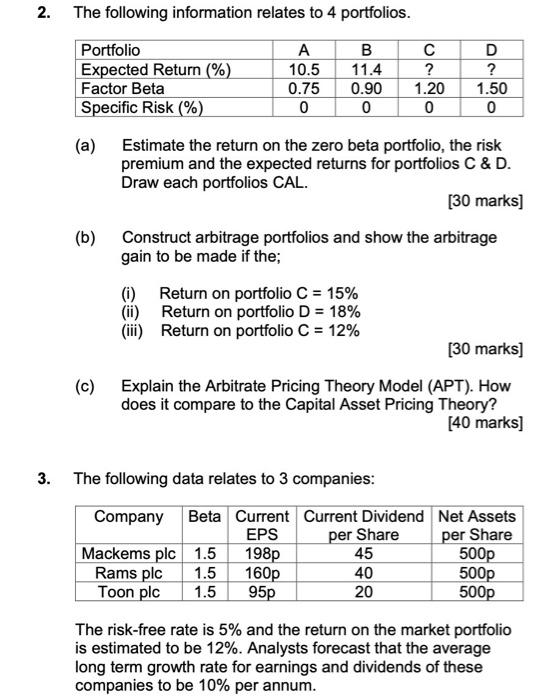
2. The following information relates to 4 portfolios. ole Portfolio A B D Expected Return (%) 10.5 11.4 ? ? Factor Beta 0.75 0.90 1.20
Step by Step Solution
There are 3 Steps involved in it
Step: 1

Get Instant Access to Expert-Tailored Solutions
See step-by-step solutions with expert insights and AI powered tools for academic success
Step: 2

Step: 3
Ace Your Homework with AI
Get the answers you need in no time with our AI-driven, step-by-step assistance
Get Started
Valuing A Business
Authors: Shannon P. Pratt, Robert F. Reilly, Robert P. Schweihs
4th Edition
0071356150, 978-0071356152