Answered step by step
Verified Expert Solution
Link Copied!
Question
1 Approved Answer

2. The following presents results of regression of test score (TestScore, measured in points) on the Student-Teacher Ratio (STR) and student characteristic control variables using
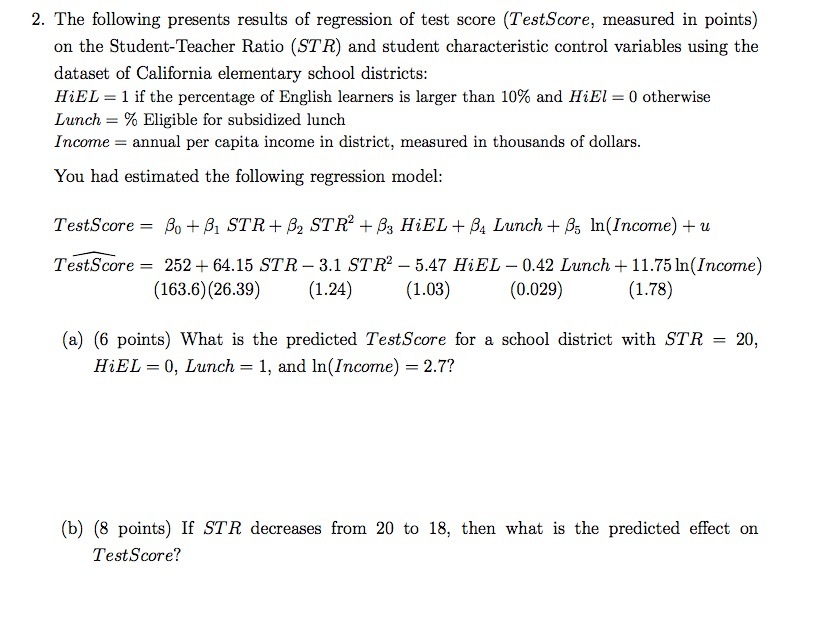
image text in transcribed
2. The following presents results of regression of test score (TestScore, measured in points) on the Student-Teacher Ratio (STR) and student characteristic control variables using the dataset of California elementary school districts: HiEL = 1 if the percentage of English learners is larger than 10% and HiEl = 0 otherwise Lunch = % Eligible for subsidized lunch Income = annual per capita income in district, measured in thousands of dollars. You had estimated the following regression model: TestScore = Bo+ 31 STR+ 82 STR" + B; HiEL + BA Lunch + B; In(Income) + u TestScore = 252 + 64.15 STR - 3.1 STR' - 5.47 HiEL - 0.42 Lunch + 11.75 In(Income) (163.6) (26.39) (1.24) (1.03) (0.029) (1.78) (a) (6 points) What is the predicted TestScore for a school district with STR = 20, HiEL = 0, Lunch = 1, and In(Income) = 2.7? (b) (8 points) If STR decreases from 20 to 18, then what is the predicted effect on Test Score

Step by Step Solution

There are 3 Steps involved in it

Step: 1

blur-text-image
Get Instant Access to Expert-Tailored Solutions

See step-by-step solutions with expert insights and AI powered tools for academic success

Step: 2

blur-text-image_2

Step: 3

blur-text-image_3

Ace Your Homework with AI

Get the answers you need in no time with our AI-driven, step-by-step assistance

Get Started

Recommended Textbook for

International Economics Theory and Policy

Authors: Paul R. Krugman, Maurice Obstfeld, Marc J. Melitz

9th Edition

978-0132146654, 0132146657, 9780273754091, 978-0273754206

More Books

Students explore these related Economics questions