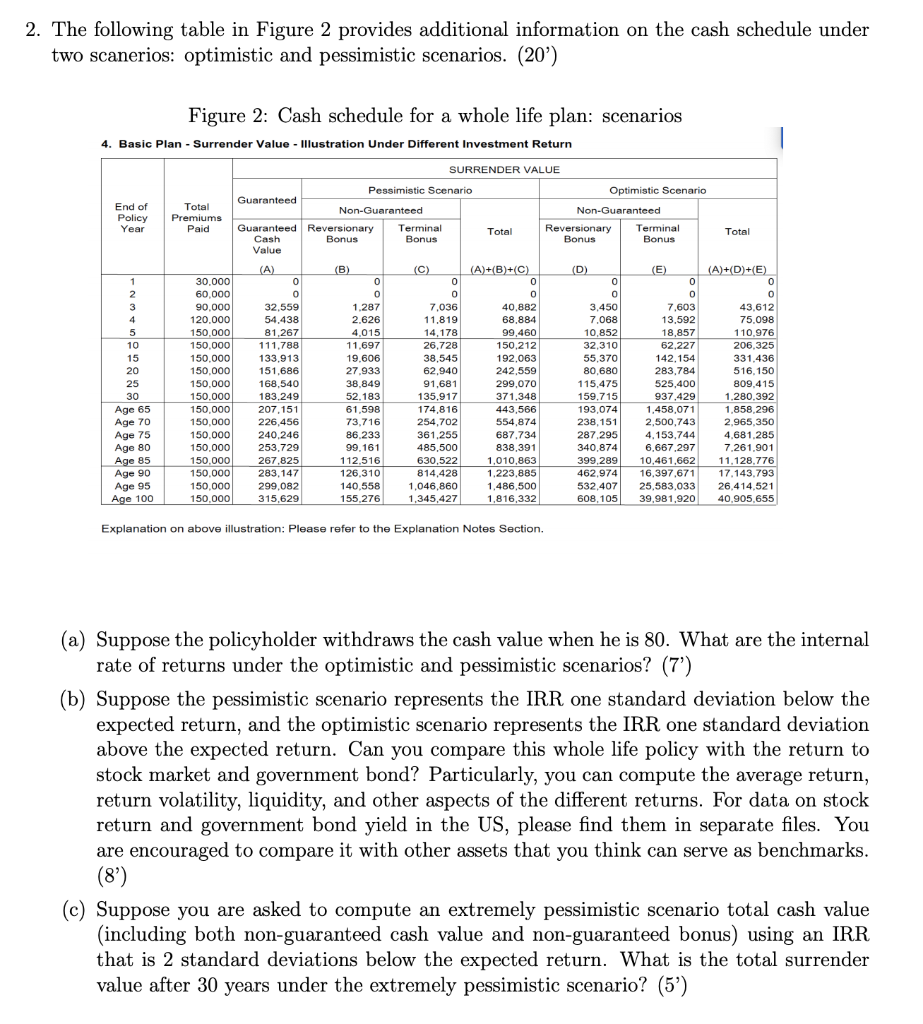
2. The following table in Figure 2 provides additional information on the cash schedule under two scanerios: optimistic and pessimistic scenarios. (20') Figure 2: Cash schedule for a whole life plan: scenarios 4. Basic Plan - Surrender Value - Illustration Under Different Investment Return SURRENDER VALUE Optimistic Scenario End of Policy Year Total Premiums Paid Pessimistic Scenario Guaranteed Non-Guaranteed Guaranteed Reversionary Terminal Cash Bonus Bonus Value Non-Guaranteed Reversionary Terminal Bonus Bonus Total Total 1 2 3 4 5 10 15 20 25 30 Age 65 Age 70 Age 75 Age 80 Age 85 Age 90 Age 95 Age 100 30.000 60,000 90.000 120.000 150,000 150.000 150.000 150.000 150,000 150.000 150,000 150,000 150.000 150.000 150.000 150.000 150,000 150,000 (A) 0 0 32,559 54.438 81,267 111.788 133.913 151,686 168,540 183,249 207.151 226,456 240.246 253.729 267,825 283,147 299,082 315,629 (B) 0 0 1.287 2.626 4.015 11.697 19.606 27.933 38,849 52.183 61,598 73.716 86.233 99,161 112,516 126,310 140,558 155 276 (C) 0 0 7,036 11.819 14,178 26.728 38,545 62,940 91,681 135,917 174,816 254,702 361.255 485,500 630,522 814,428 1,046,860 1,345,427 (A)+(B)+(C) 0 0 40,882 68.884 99,460 150,212 192.063 242,559 299,070 371.348 443,566 554,874 687,734 838,391 1,010,863 1.223,885 1,486,500 1,816,332 (D) 0 0 3,450 7.068 10.8521 32,310 55,370 80.680 115,475 159,7151 193,074 238,151 287,295 340,874 399,289 462,974 532,407 608,105 (E) 0 0 7,603 13.592 18.857 62,227 142, 154 283,784 525,400 937,429 1,458,071 2,500,743 4,153,744 6,667,297 10,461,662 16,397.671 25,583,033 39,981,920 (A)+(D)+E) 0 0 43,612 75.098 110.976 206,325 331,436 516,150 809.415 1.280.392 1,858,296 2.965,350 4.681.285 7,261,901 11.128.776 17.143.793 26,414,521 40.905,655 Explanation on above illustration: Please refer to the Explanation Notes Section. (a) Suppose the policyholder withdraws the cash value when he is 80. What are the internal rate of returns under the optimistic and pessimistic scenarios? (7') (b) Suppose the pessimistic scenario represents the IRR one standard deviation below the expected return, and the optimistic scenario represents the IRR one standard deviation above the expected return. Can you compare this whole life policy with the return to stock market and government bond? Particularly, you can compute the average return, return volatility, liquidity, and other aspects of the different returns. For data on stock return and government bond yield in the US, please find them in separate files. You are encouraged to compare it with other assets that you think can serve as benchmarks. (8) (c) Suppose you are asked to compute an extremely pessimistic scenario total cash value (including both non-guaranteed cash value and non-guaranteed bonus) using an IRR that is 2 standard deviations below the expected return. What is the total surrender value after 30 years under the extremely pessimistic scenario? (5') 2. The following table in Figure 2 provides additional information on the cash schedule under two scanerios: optimistic and pessimistic scenarios. (20') Figure 2: Cash schedule for a whole life plan: scenarios 4. Basic Plan - Surrender Value - Illustration Under Different Investment Return SURRENDER VALUE Optimistic Scenario End of Policy Year Total Premiums Paid Pessimistic Scenario Guaranteed Non-Guaranteed Guaranteed Reversionary Terminal Cash Bonus Bonus Value Non-Guaranteed Reversionary Terminal Bonus Bonus Total Total 1 2 3 4 5 10 15 20 25 30 Age 65 Age 70 Age 75 Age 80 Age 85 Age 90 Age 95 Age 100 30.000 60,000 90.000 120.000 150,000 150.000 150.000 150.000 150,000 150.000 150,000 150,000 150.000 150.000 150.000 150.000 150,000 150,000 (A) 0 0 32,559 54.438 81,267 111.788 133.913 151,686 168,540 183,249 207.151 226,456 240.246 253.729 267,825 283,147 299,082 315,629 (B) 0 0 1.287 2.626 4.015 11.697 19.606 27.933 38,849 52.183 61,598 73.716 86.233 99,161 112,516 126,310 140,558 155 276 (C) 0 0 7,036 11.819 14,178 26.728 38,545 62,940 91,681 135,917 174,816 254,702 361.255 485,500 630,522 814,428 1,046,860 1,345,427 (A)+(B)+(C) 0 0 40,882 68.884 99,460 150,212 192.063 242,559 299,070 371.348 443,566 554,874 687,734 838,391 1,010,863 1.223,885 1,486,500 1,816,332 (D) 0 0 3,450 7.068 10.8521 32,310 55,370 80.680 115,475 159,7151 193,074 238,151 287,295 340,874 399,289 462,974 532,407 608,105 (E) 0 0 7,603 13.592 18.857 62,227 142, 154 283,784 525,400 937,429 1,458,071 2,500,743 4,153,744 6,667,297 10,461,662 16,397.671 25,583,033 39,981,920 (A)+(D)+E) 0 0 43,612 75.098 110.976 206,325 331,436 516,150 809.415 1.280.392 1,858,296 2.965,350 4.681.285 7,261,901 11.128.776 17.143.793 26,414,521 40.905,655 Explanation on above illustration: Please refer to the Explanation Notes Section. (a) Suppose the policyholder withdraws the cash value when he is 80. What are the internal rate of returns under the optimistic and pessimistic scenarios? (7') (b) Suppose the pessimistic scenario represents the IRR one standard deviation below the expected return, and the optimistic scenario represents the IRR one standard deviation above the expected return. Can you compare this whole life policy with the return to stock market and government bond? Particularly, you can compute the average return, return volatility, liquidity, and other aspects of the different returns. For data on stock return and government bond yield in the US, please find them in separate files. You are encouraged to compare it with other assets that you think can serve as benchmarks. (8) (c) Suppose you are asked to compute an extremely pessimistic scenario total cash value (including both non-guaranteed cash value and non-guaranteed bonus) using an IRR that is 2 standard deviations below the expected return. What is the total surrender value after 30 years under the extremely pessimistic scenario? (5')


