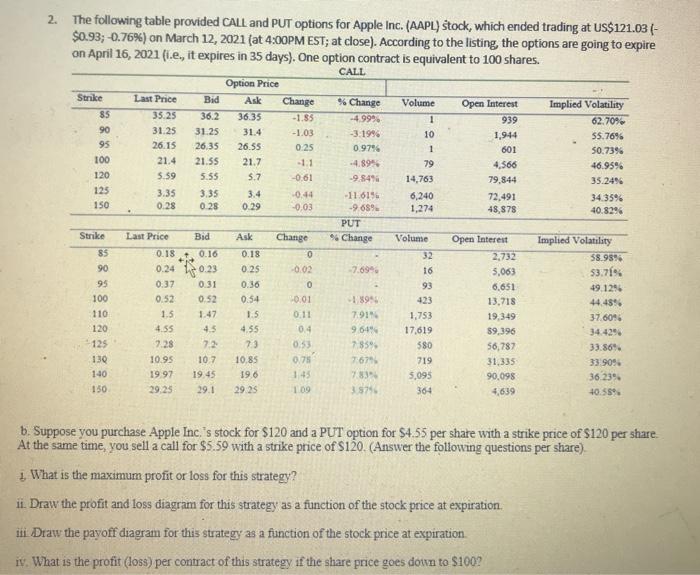
2. The following table provided CALL and PUT options for Apple Inc. (AAPL) Stock, which ended trading at US$121.03 - $0.93; -0.76%) on March 12, 2021 (at 4:00PM EST; at close). According to the listing the options are going to expire on April 16, 2021 (1.e., it expires in 35 days). One option contract is equivalent to 100 shares. CALL Volume 1 Strike SS 90 95 100 120 125 150 Last Price 35.25 31.25 26.15 21.4 5.59 10 Option Price Bid Ask Change 36.2 36.35 -1.85 31.25 31.4 -1.03 26,35 26.55 0.25 21.55 21.7 5.55 5.7 -0.61 3.33 3.4 -0.44 0.28 0.29 -0,03 % Change -4.99 -3.1996 0.97% -4.89 -9.8494 -11 6194 -9689 PUT Change 1 Open Interest 939 1,944 601 4,566 79,844 72,491 48,878 Implied Volatility 62.70% SS.7696 50.73% 46.95% 35.2496 79 14,763 6,240 1,274 3.35 0.28 34.35% 40.829 Change 0 -0.02 -7.69 0 Strike 85 90 95 100 110 120 125 130 140 150 Last Price Bid 0.18 0.16 ++ 0.24 0.23 0.37 0.31 0.52 0.52 1.5 4.55 45 7.28 72 10.95 10.7 1997 19.45 29.25 29.1 Ask 0.18 0.25 0.36 0.54 1.5 4.35 73 0.01 0.11 04 0.53 0.75 145 1.09 1894 7.91" 964 7.859 7679 78 3.8756 Volume 32 16 93 423 1,753 17.619 580 719 5,095 364 Open Interest 2,732 3,063 6,651 13,718 19,349 89,396 56,787 31,335 90,098 4,639 Implied Volatility 58.98% 53.7194 49.129 44.48% 37.6096 34.429 33.86% 33.909. 36.23% 40.58% 10.85 19.6 29.25 b. Suppose you purchase Apple Inc.'s stock for $120 and a PUT option for $4.55 per share with a strike price of $120 per share. At the same time, you sell a call for $5.59 with a strike price of $120. (Answer the following questions per share) 1 What is the maximum profit or loss for this strategy? ii. Draw the profit and loss diagram for this strategy as a function of the stock price at expiration i Draw the payoff diagram for this strategy as a function of the stock price at expiration w What is the profit (loss) per contract of this strategy if the share price goes down to $100