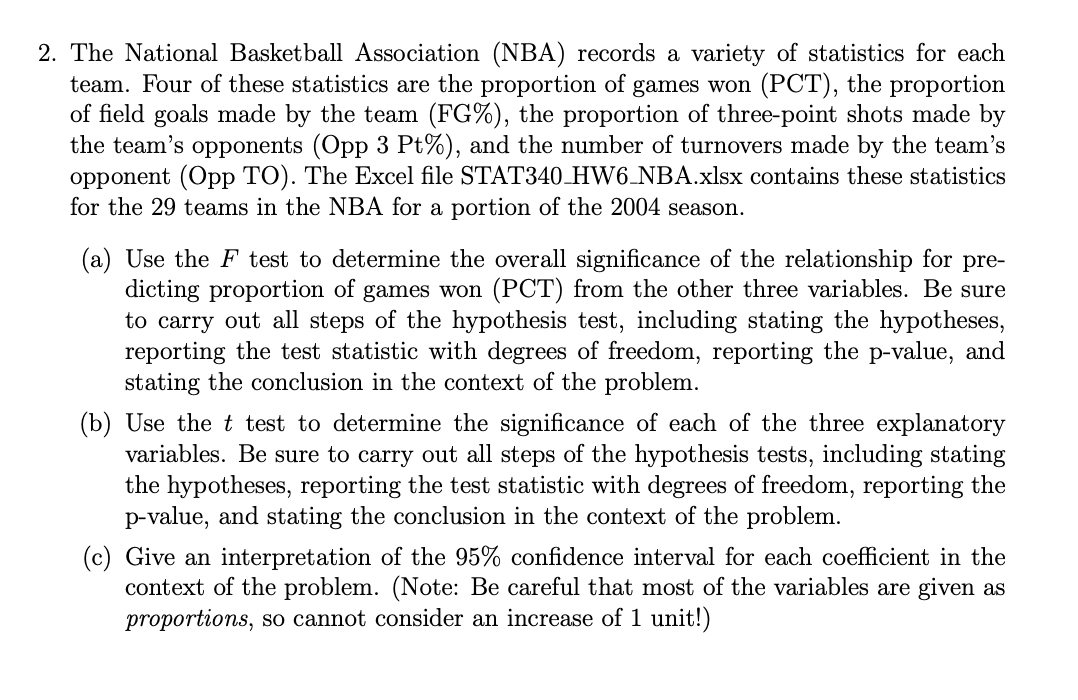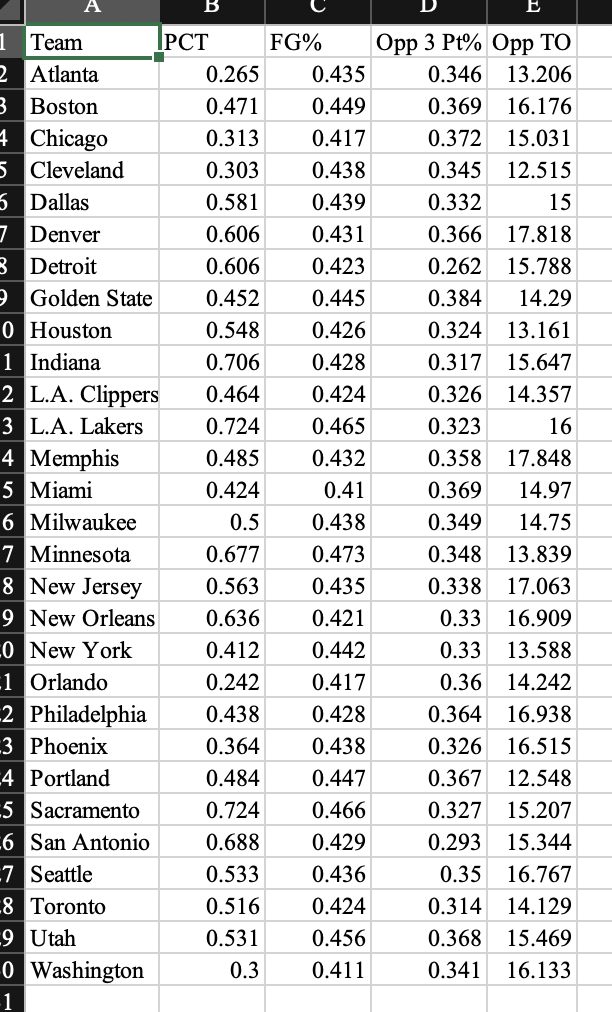

2. The National Basketball Association (NBA) records a variety of statistics for each team. Four of these statistics are the proportion of games won (PCT), the proportion of field goals made by the team (FG\%), the proportion of three-point shots made by the team's opponents (Opp 3Pt% ), and the number of turnovers made by the team's opponent (Opp TO). The Excel file STAT340_HW6_NBA.xlsx contains these statistics for the 29 teams in the NBA for a portion of the 2004 season. (a) Use the F test to determine the overall significance of the relationship for predicting proportion of games won (PCT) from the other three variables. Be sure to carry out all steps of the hypothesis test, including stating the hypotheses, reporting the test statistic with degrees of freedom, reporting the p-value, and stating the conclusion in the context of the problem. (b) Use the t test to determine the significance of each of the three explanatory variables. Be sure to carry out all steps of the hypothesis tests, including stating the hypotheses, reporting the test statistic with degrees of freedom, reporting the p-value, and stating the conclusion in the context of the problem. (c) Give an interpretation of the 95% confidence interval for each coefficient in the context of the problem. (Note: Be careful that most of the variables are given as proportions, so cannot consider an increase of 1 unit!) 2. The National Basketball Association (NBA) records a variety of statistics for each team. Four of these statistics are the proportion of games won (PCT), the proportion of field goals made by the team (FG\%), the proportion of three-point shots made by the team's opponents (Opp 3Pt% ), and the number of turnovers made by the team's opponent (Opp TO). The Excel file STAT340_HW6_NBA.xlsx contains these statistics for the 29 teams in the NBA for a portion of the 2004 season. (a) Use the F test to determine the overall significance of the relationship for predicting proportion of games won (PCT) from the other three variables. Be sure to carry out all steps of the hypothesis test, including stating the hypotheses, reporting the test statistic with degrees of freedom, reporting the p-value, and stating the conclusion in the context of the problem. (b) Use the t test to determine the significance of each of the three explanatory variables. Be sure to carry out all steps of the hypothesis tests, including stating the hypotheses, reporting the test statistic with degrees of freedom, reporting the p-value, and stating the conclusion in the context of the problem. (c) Give an interpretation of the 95% confidence interval for each coefficient in the context of the problem. (Note: Be careful that most of the variables are given as proportions, so cannot consider an increase of 1 unit!)


