Answered step by step
Verified Expert Solution
Question
1 Approved Answer
2) The results of a very comprehensive drained triaxial testing program performed in Sacramento River sands are summarized in the following figure. a) Briefly explain
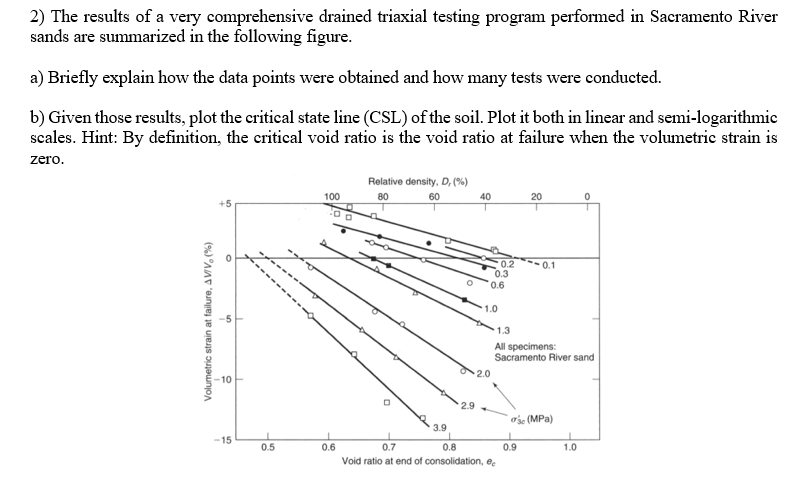
2) The results of a very comprehensive drained triaxial testing program performed in Sacramento River sands are summarized in the following figure. a) Briefly explain how the data points were obtained and how many tests were conducted. b) Given those results, plot the critical state line (CSL) of the soil. Plot it both in linear and semi-logarithmic scales. Hint: By definition, the critical void ratio is the void ratio at failure when the volumetric strain is zero. Relative density, D. (%) 80 60 100 40 20 00 0.1 02 0.3 0.6 O 1.0 Volumetric strain at failure, AVV. (%) -5 1.3 All specimens: Sacramento River sand 2.0 10 2.9 Sc (MPa) 3.9 -15 0.5 0.6 0.9 1.0 0.7 0.8 Void ratio at end of consolidation, ee 2) The results of a very comprehensive drained triaxial testing program performed in Sacramento River sands are summarized in the following figure. a) Briefly explain how the data points were obtained and how many tests were conducted. b) Given those results, plot the critical state line (CSL) of the soil. Plot it both in linear and semi-logarithmic scales. Hint: By definition, the critical void ratio is the void ratio at failure when the volumetric strain is zero. Relative density, D. (%) 80 60 100 40 20 00 0.1 02 0.3 0.6 O 1.0 Volumetric strain at failure, AVV. (%) -5 1.3 All specimens: Sacramento River sand 2.0 10 2.9 Sc (MPa) 3.9 -15 0.5 0.6 0.9 1.0 0.7 0.8 Void ratio at end of consolidation, ee
Step by Step Solution
There are 3 Steps involved in it
Step: 1
Get Instant Access to Expert-Tailored Solutions
See step-by-step solutions with expert insights and AI powered tools for academic success
Step: 2
Step: 3
Ace Your Homework with AI
Get the answers you need in no time with our AI-driven, step-by-step assistance
Get Started