Answered step by step
Verified Expert Solution
Link Copied!

Question

1 Approved Answer

2. The table below shows the returns for company A and company B over the past 5 years. Year 2015 2016 2017 2018 2019 Return
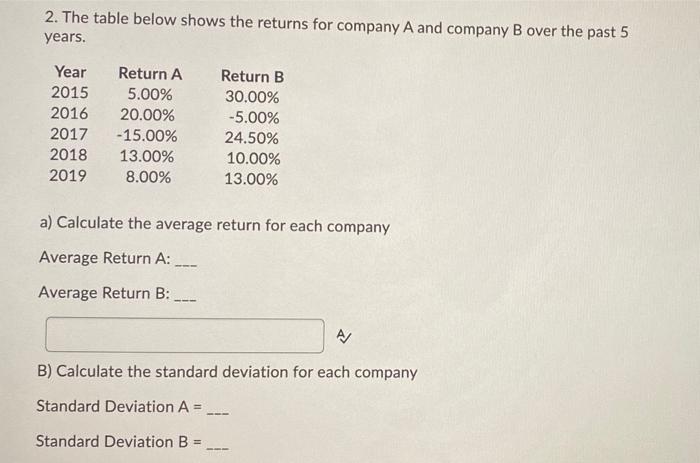
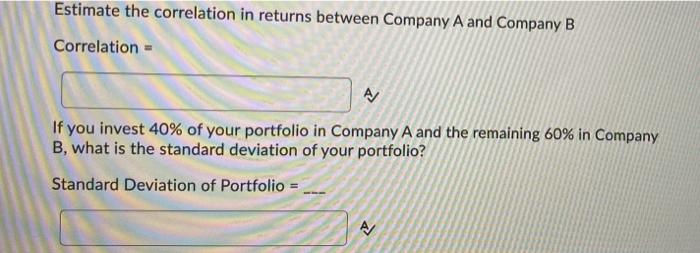
image text in transcribed
2. The table below shows the returns for company A and company B over the past 5 years. Year 2015 2016 2017 2018 2019 Return A 5.00% 20.00% -15.00% 13.00% 8.00% Return B 30.00% -5.00% 24.50% 10.00% 13.00% a) Calculate the average return for each company Average Return A: Average Return B: A/ B) Calculate the standard deviation for each company Standard Deviation A = Standard Deviation B = Estimate the correlation in returns between Company A and Company B Correlation - A/ If you invest 40% of your portfolio in Company A and the remaining 60% in Company B, what is the standard deviation of your portfolio? Standard Deviation of Portfolio A/

Step by Step Solution

There are 3 Steps involved in it

Step: 1

blur-text-image

Get Instant Access to Expert-Tailored Solutions

See step-by-step solutions with expert insights and AI powered tools for academic success

Step: 2

blur-text-image

Step: 3

blur-text-image

Ace Your Homework with AI

Get the answers you need in no time with our AI-driven, step-by-step assistance

Get Started

Recommended Textbook for

Finance

Authors: Angelico Groppelli, Ehsan Nikbakht

7th Edition

1438010362, 9781438010366

More Books

Students also viewed these Finance questions

Question

Define "Rights Issue".

Answered: 1 week ago

Question

Discuss the Rights issue procedure in detail.

Answered: 1 week ago

Question

Discuss the Rights issue procedure in detail.

Answered: 1 week ago

Question

Explain the procedure for valuation of shares.

Answered: 1 week ago

Question

Which months of this year 5 Mondays ?

Answered: 1 week ago