Answered step by step
Verified Expert Solution
Link Copied!

Question

1 Approved Answer

2. The table shows the driving experiences (in years) and monthly auto insurance premiums for a random sample of eight drivers. Driving Experience bears) Monthly
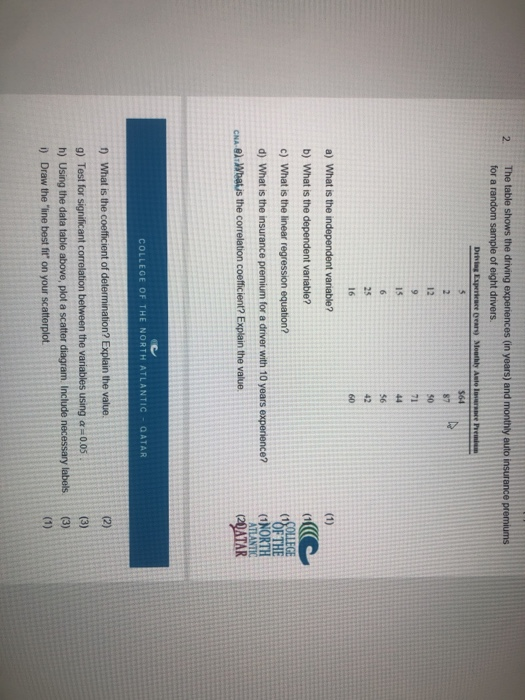
image text in transcribed
2. The table shows the driving experiences (in years) and monthly auto insurance premiums for a random sample of eight drivers. Driving Experience bears) Monthly Antelor 5 $64 2 87 30 12 9 15 71 44 6 25 42 16 60 (1) a) What is the independent variable? b) What is the dependent variable? c) What is the linear regression equation? d) What is the insurance premium for a driver with 10 years experience? CNA-Bl: What is the correlation coefficient? Explain the value COLLEGE "OF THE (1 NORTH ATLANTIC (29ATAR COLLEGE OF THE NORTH ATLANTIC - QATAR (2) (3) f) What is the coefficient of determination? Explain the value g) Test for significant correlation between the variables using a =0.05 h) Using the data table above, plot a scatter diagram. Include necessary labels D) Draw the line best fit on your scatterplot (3) (1)

Step by Step Solution

There are 3 Steps involved in it

Step: 1

blur-text-image

Get Instant Access to Expert-Tailored Solutions

See step-by-step solutions with expert insights and AI powered tools for academic success

Step: 2

blur-text-image_2

Step: 3

blur-text-image_3

Ace Your Homework with AI

Get the answers you need in no time with our AI-driven, step-by-step assistance

Get Started

Recommended Textbook for

Retail Industry IRS Audit Technique Guide

Authors: Internal Revenue Service

1st Edition

1304114783, 978-1304114785

More Books

Students also viewed these Accounting questions