Answered step by step
Verified Expert Solution
Link Copied!

Question

1 Approved Answer

2) Use the available data in the table below for parts A, B, and C of this question. A. Complete the table by entering the
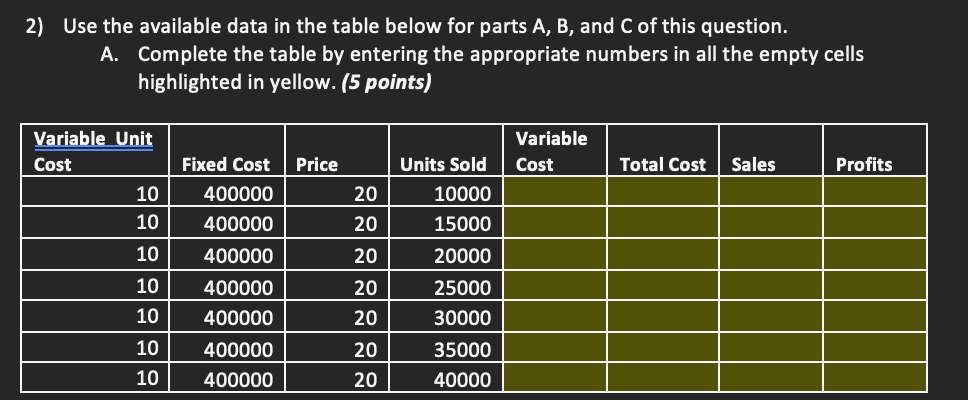
image text in transcribedimage text in transcribed

2) Use the available data in the table below for parts A, B, and C of this question. A. Complete the table by entering the appropriate numbers in all the empty cells highlighted in yellow. (5 points) Variable Unit Cost Variable Cost Fixed Cost Price Units Sold Total Cost Sales Profits 10 10 20 20 10000 15000 10 20 20000 10 10 400000 400000 400000 400000 400000 400000 400000 25000 30000 20 20 20 20 35000 10 10 40000 B. With Units Sold on the X-axis and Dollars on the Y-axis, plot the lines that represent Fixed Cost, Variable Cost, Total Cost, and Sales. Insert a picture of the plot in the space below. (5 points)

Step by Step Solution

There are 3 Steps involved in it

Step: 1

blur-text-image

Get Instant Access to Expert-Tailored Solutions

See step-by-step solutions with expert insights and AI powered tools for academic success

Step: 2

blur-text-image_2

Step: 3

blur-text-image_3

Ace Your Homework with AI

Get the answers you need in no time with our AI-driven, step-by-step assistance

Get Started

Recommended Textbook for

Small Brewery Finance

Authors: Maria Pearman

1st Edition

1938469526, 978-1938469527

More Books

Students also viewed these Finance questions